# Manual instrumentation
Source: https://docs.nestjs.com/observability/manual-instrumentation
Most of the SDK is automatic instrumentation: you configure it once and it decides what to record. `TracerService` is the manual half. Inject it anywhere in your application to add spans inside an already-traced request, attach context to that request, capture errors you handled yourself, and report your own metrics.
```typescript
import { Injectable } from '@nestjs/common';
import { TracerService } from '@nestjs/observe';
@Injectable()
export class CatsService {
constructor(private readonly tracerService: TracerService) {}
}
```
`ObserveModule.forRoot()` registers a global module that exports `TracerService`, so you can inject it in any module without importing `ObserveModule` again. (`forRootAsync()` is global too, unless you pass `global: false`.) Every method reads the trace from the ambient async context. Outside a request, job, or other instrumented operation there is no trace to attach to, so nothing is recorded: `createSpan()` runs its callback untraced, `activeSpan()` resolves to a span that records nothing, `setAttribute()` does nothing, `getAttribute()` returns `undefined`, `captureError()` records nothing and logs a warning once, and `currentTraceId()` returns `null`. Before SDK 0.3.27, these calls threw. [Custom metrics](#custom-metrics) aren't tied to a trace and work anywhere.
#### Creating spans
`createSpan(name, callback)` runs the callback inside a new span nested under the currently active one, and returns a promise of the callback's return value. The span's duration is the callback's duration, so `await` anything you want measured:
```typescript
async findOne(id: string, activeUser: ActiveUserData) {
return this.tracerService.createSpan('cats.findOne', async (span) => {
span.addTags({ userId: activeUser.sub, catId: id });
return this.catsRepository.findOne(id);
});
}
```
Spans nest by call stack: a `createSpan()` inside another `createSpan()` callback becomes its child, which produces the waterfall on the trace detail page. The callback may be synchronous or asynchronous. Auto-instrumented spans (controller methods, providers, database calls) and your custom spans share the same tree, so a hand-named span appears exactly where it ran relative to everything else.
The `span` argument is a `TraceSpanDelegate`. Its `addTags(tags)` method (or `setTag(key, value)` for a single entry) attaches key-value pairs to that span alone. Like the `tags` option described in [SDK → Tags and custom attributes](/observability/sdk#tags-and-custom-attributes), they're searchable and shown on the span in the trace view. The difference is scope: that option covers every request, while these tags cover one span.
`activeSpan()` resolves to the `TraceSpanDelegate` of the currently active span without creating a new one. Use it to tag the enclosing span from code that didn't create it:
```typescript
const span = await this.tracerService.activeSpan();
span.addTags({ cacheHit: 'false' });
```
If no span is active, it resolves to a span that records nothing, so tags added to it are dropped.
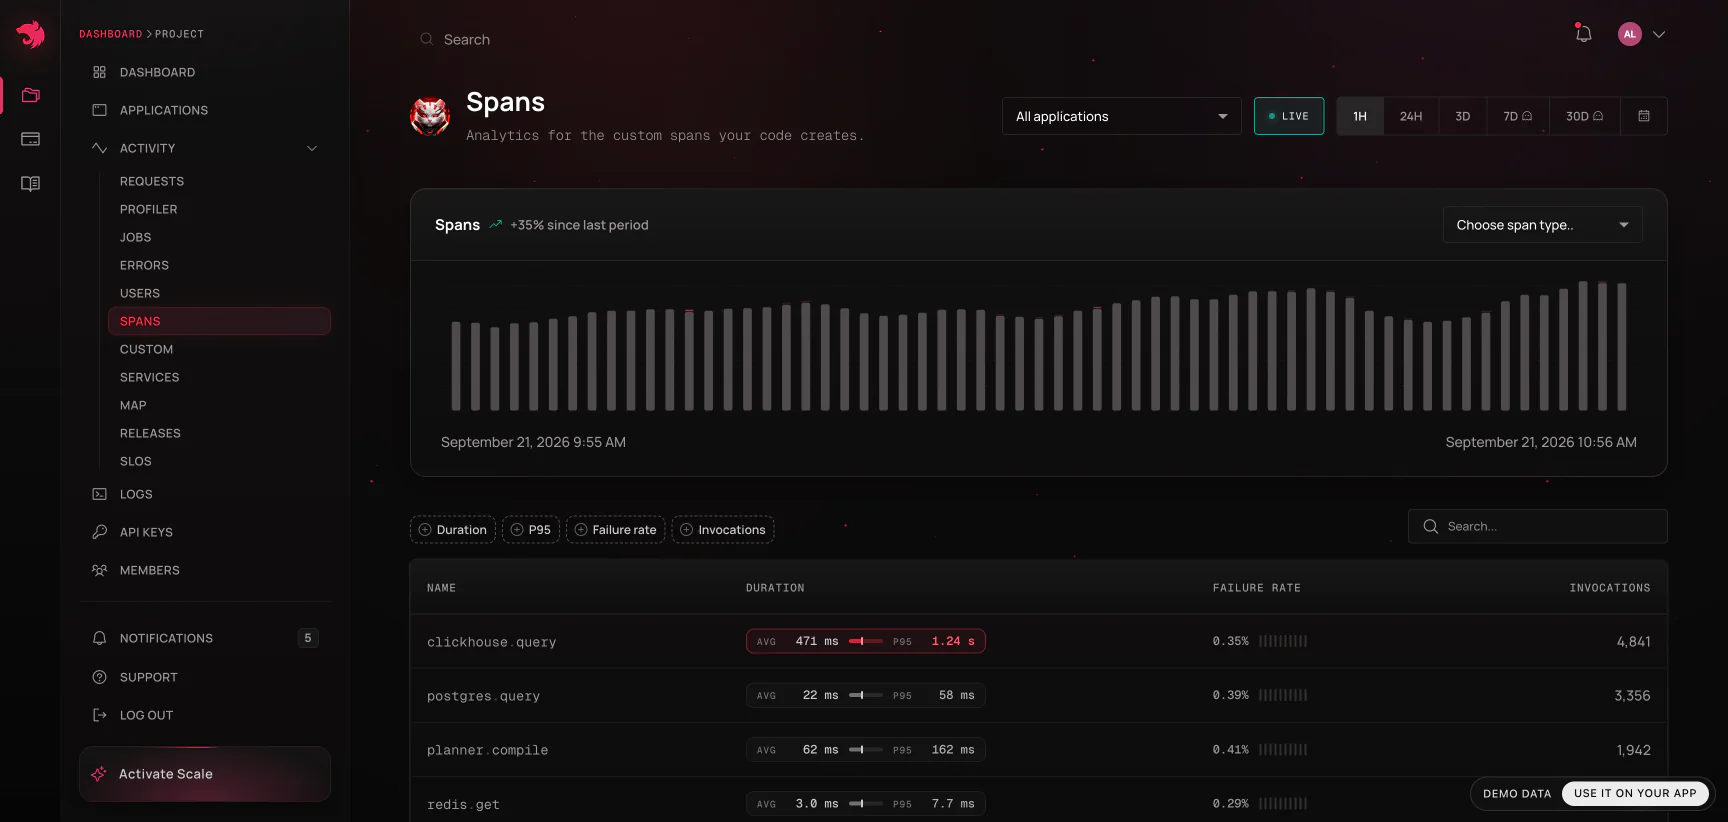
> info **Hint** The **Spans** analytics view aggregates by span name, across every route that calls them. Pick names that describe the work (`orders.recalculate`, `cache.lookup`) rather than the caller, so the dashboard can tell you whether something is slow everywhere or only from one endpoint.
#### Capturing handled errors
Errors that propagate out of a controller, job, or span are recorded automatically. `captureError()` is for the ones that don't: anything you caught and handled but still want visible in the dashboard:
```typescript
try {
await this.billing.sync(accountId);
} catch (error) {
await this.tracerService.captureError(error as Error, {
accountId,
retryable: 'true',
});
}
```
The error is attached to the current trace, with the optional tags recorded alongside it, and gets the same source-context treatment as any other captured error if [`sourceContext`](/observability/sdk#error-source-context) is enabled.
#### Request-scoped attributes
`setAttribute(key, value)` and `getAttribute(key)` write and read the trace's own context store. Its values live for the duration of the request and are readable from anywhere downstream, without threading them through every function signature:
```typescript
this.tracerService.setAttribute('tenantId', tenant.id);
// ...later, in a different service on the same request
const tenantId = this.tracerService.getAttribute('tenantId');
```
`getAttribute()` returns `undefined` for a key that was never set, and outside a traced context, where `setAttribute()` does nothing. An attribute set in a guard, an interceptor, or any other traced call stays for the rest of the request.
The trace id lives in the same store, so `getAttribute(traceIdKey)` retrieves the current trace id, e.g., to correlate with an external system or to [propagate it to another service](/observability/distributed-tracing). `currentTraceId()` is a shorthand for that lookup, and returns `null` outside a traced context.
To type the store, pass its shape as `TracerService`'s first type argument. Keys and values are then checked against it, including nested paths:
```typescript
interface RequestStore {
tenantId: string;
flags: { betaCheckout: boolean };
}
@Injectable()
export class CheckoutService {
constructor(private readonly tracerService: TracerService) {}
enableBeta() {
this.tracerService.setAttribute('flags.betaCheckout', true);
}
}
```
> info **Hint** `ObserveModule` also exports the `AsyncLocalStorage` instance that holds the trace context, under the `AsyncLocalStorage` class. Each operation's store is a `Map` you can read and write directly; `setAttribute()`/`getAttribute()` are the typed way in. If you already use the pattern described in the [Async local storage](/recipes/async-local-storage) recipe, this store can replace your hand-rolled one: keep your values in its `Map`, and leave opening the store to the SDK, since `run()` or `enterWith()` with a store of your own replaces the operation's. If you keep a store of your own as well, provide it under a token of your own rather than the `AsyncLocalStorage` class.
#### Custom metrics
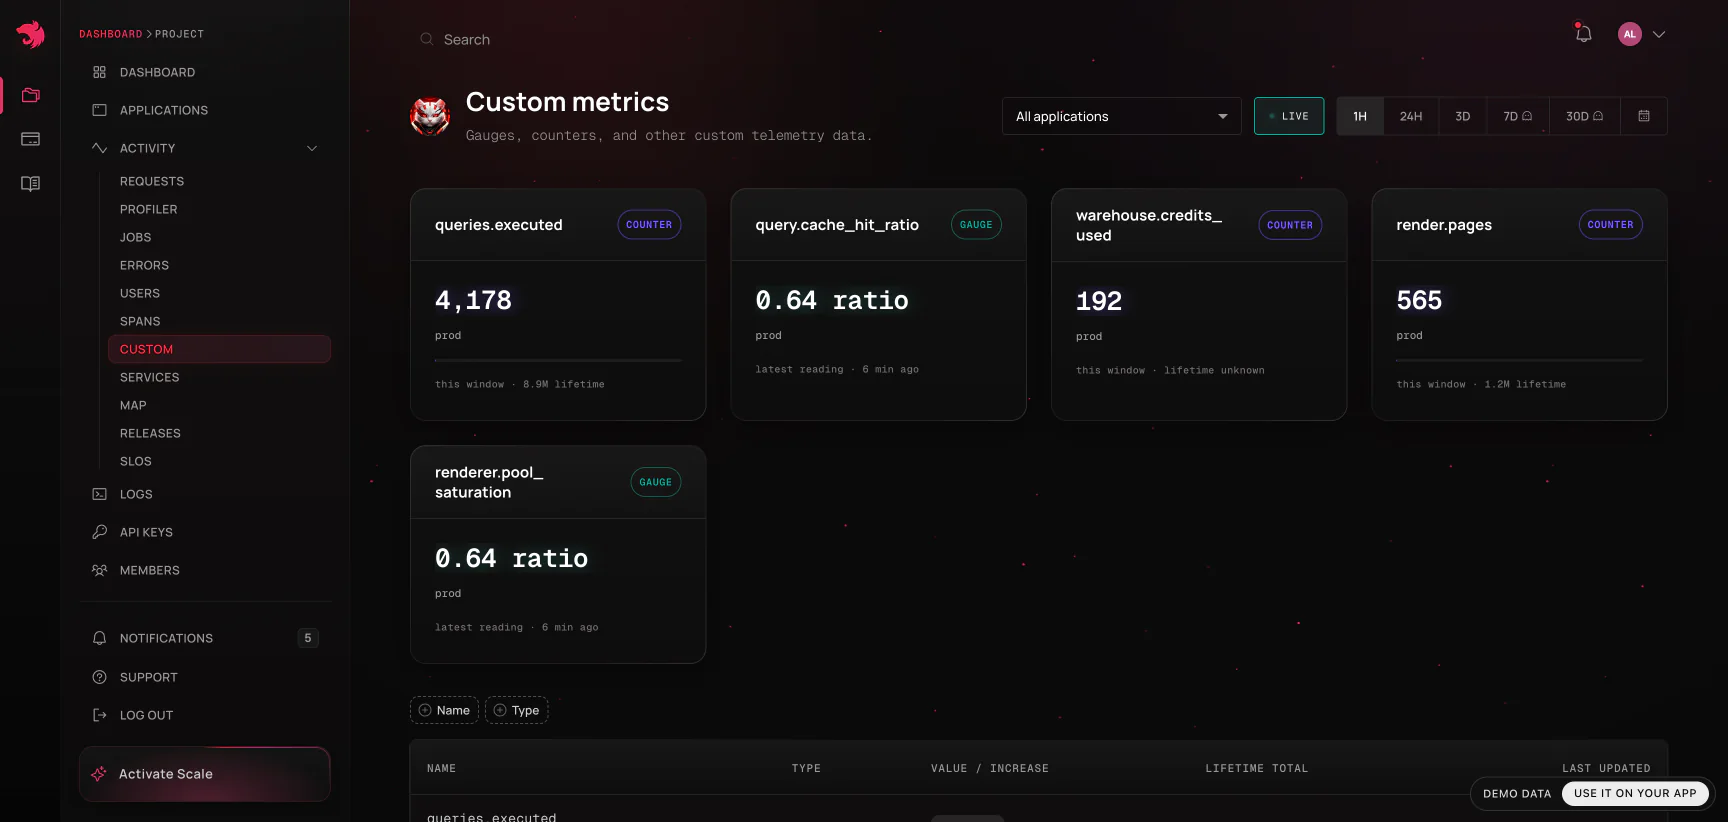
Three metric types are available, each created by name (or retrieved, if the name already exists). They report into the **Custom** section of the dashboard, and you can alert on them like any built-in metric.
Unlike the methods above, metrics aren't tied to a trace, so you can report them from anywhere, including startup and shutdown code, `onModuleInit()` hooks, and cron jobs.
| Method | For | Reporting method |
| --------- | -------------------------------------------------------------------------- | ---------------- |
| `counter` | Values that only go up - requests served, orders placed, retries attempted | `increment()` |
| `gauge` | Values that go up and down - queue depth, active connections, cache ratio | `increment()`, `decrement()`, `setValue(value)` |
| `summary` | Distributions you want quantiles over - latency, payload size | `observe(value)` |
```typescript
this.tracerService
.counter('cats.lookups', { description: 'Number of cat lookups' })
.increment();
this.tracerService
.gauge('cats.active.sessions', {
kind: 'ratio',
initialValue: 0,
description: 'Number of active sessions',
})
.increment();
const latency = this.tracerService.summary('cats.lookup.duration', {
description: 'Duration of cat lookups in milliseconds',
});
const startedAt = performance.now();
try {
return await this.catsRepository.findOne(id);
} finally {
// Observed in a finally so a failed lookup still lands in the distribution -
// dropping the slow failures is how a latency summary ends up flattering itself.
latency.observe(performance.now() - startedAt);
}
```
Calling `counter('orders.placed')` twice returns the same instance, so you don't need to hold a reference in a field, though doing so is cheaper on a hot path. Passing attributes on a later call updates the existing metric's description and labels in place.
| Attribute | Applies to | Description |
| -------------- | ----------------------- | ------------------------------------------------------------------------------------------------------------------------------------- |
| `description` | counter, gauge, summary | Shown alongside the metric in the dashboard. Worth setting: a bare metric name rarely explains itself to a future reader. |
| `labels` | counter, gauge, summary | Dimensions the metric is broken down by, so the chart can be split rather than showing one aggregate line. |
| `initialValue` | counter, gauge | Starting value. Only applied while the metric is still at `0`, so a restart-time declaration doesn't clobber a value already counted. |
| `kind` | gauge | `'ratio'` (default) for values that stand alone per report, or `'additive'` for values that sum across reporting instances. |
| `sampleSize` | summary | How many observations per label are retained to compute quantiles from, which bounds the summary's memory under load. |
A metric that has been declared but never reported reads as "unknown" rather than `0` in the dashboard. This is a real state, not missing data: "we have never heard from this metric" and "this metric is currently zero" are different facts, and showing the second in place of the first would hide a broken deploy.
#### API summary
| Method | Needs a trace | Description |
| --------------------------------- | :-----------: | ------------------------------------------------------------------- |
| `createSpan(name, callback)` | ✓ | Run `callback` inside a new child span; returns its result |
| `activeSpan()` | ✓ | Resolves to the `TraceSpanDelegate` of the span in flight |
| `captureError(error, tags?)` | ✓ | Record a handled error on the current trace |
| `setAttribute(key, value)` | ✓ | Write to the request-scoped context store |
| `getAttribute(key)` | ✓ | Read from the request-scoped context store |
| `currentTraceId()` | ✗ | The active trace id, or `null` outside a trace |
| `counter(name, attributes?)` | ✗ | Get or create a monotonically increasing metric |
| `gauge(name, attributes?)` | ✗ | Get or create a metric that can go up and down |
| `summary(name, attributes?)` | ✗ | Get or create a distribution metric with quantiles |
#### Where to go next
- [Distributed tracing](/observability/distributed-tracing) - use `currentTraceId()` to keep one trace across service boundaries.
- [Dashboard](/observability/dashboard) - where spans, captured errors, and custom metrics show up.