
Overview
Hint This chapter covers the Nest Devtools integration with the Nest framework. If you are looking for the Devtools application, visit the Devtools website.
Nest Devtools gives you an interactive, always up-to-date view of your application's internals: modules, providers, controllers, and the routes and events that tie them together. Instead of piecing that picture together from imports and constructor signatures, you get a live graph you can search, filter, and click through. This chapter walks you through connecting your local application to Devtools for the first time.
Getting started takes less than five minutes. Open your main.ts file and set the snapshot attribute to true in the application options object:
async function bootstrap() {
  const app = await NestFactory.create(AppModule, {
    snapshot: true,
  });
  await app.listen(3000);
}
This tells Nest to collect the metadata Devtools needs to reconstruct and visualize your application's dependency graph.
Next, install the Devtools integration package:
$ npm i @nestjs/devtools-integration
With the package installed, open app.module.ts and import DevtoolsModule:
@Module({
  imports: [
    DevtoolsModule.register({
      http: process.env.NODE_ENV !== 'production',
    }),
  ],
  controllers: [AppController],
  providers: [AppService],
})
export class AppModule {}
Note We checkNODE_ENVhere becauseDevtoolsModuleshould never run in production.
The http flag controls whether DevtoolsModule starts its introspection server at all. With the flag disabled, the module doesn't expose anything, which is the safety net you want if this configuration accidentally makes it past a review. The runtime overhead is negligible: with snapshot enabled, Nest collects the graph metadata once, while the application bootstraps, so your application's regular request handling is unaffected.
Once DevtoolsModule is imported and your application is running (npm run start:dev), open Devtools to see your introspected graph.
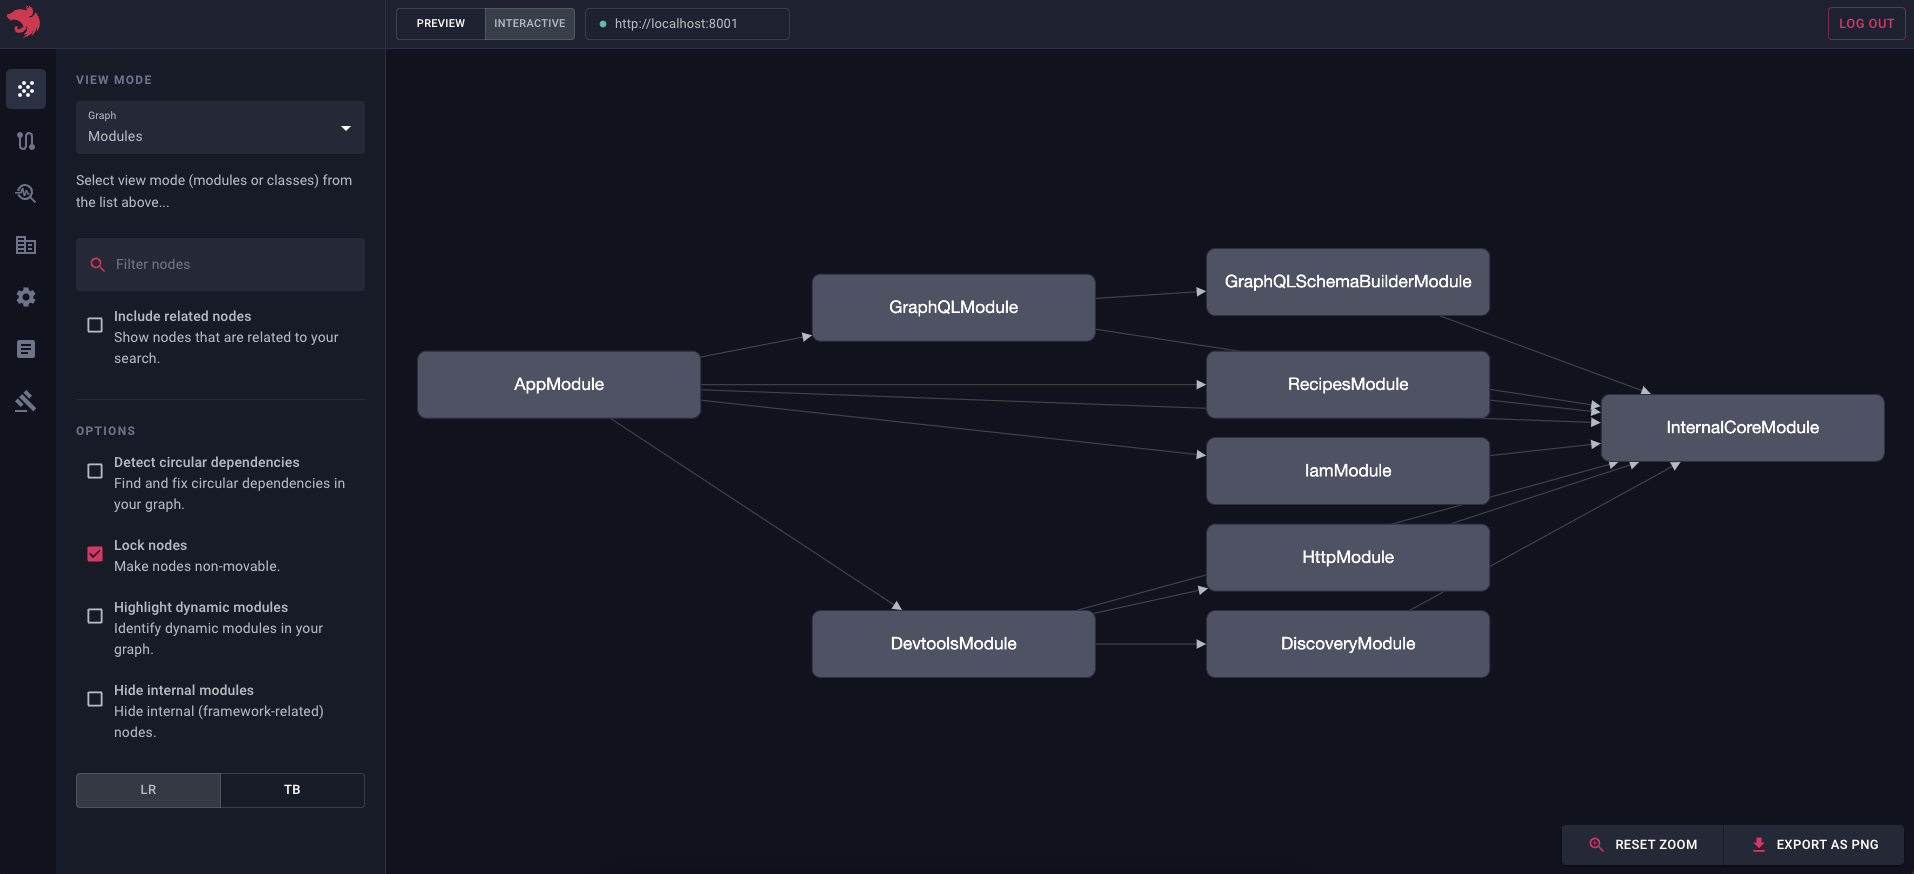
Hint Every module connects to InternalCoreModule, a global module that Nest always imports into the root module. Because it's registered globally, Nest draws an edge between it and every other module in your application. To declutter the view, select the Hide global modules checkbox in the sidebar.
Under the hood, DevtoolsModule starts a lightweight HTTP server (on port 8000 by default) that the dashboard uses to introspect your application in real time. No extra configuration is required. If port 8000 is taken, pass a different one with the port option of DevtoolsModule.register().
To confirm everything is wired up correctly, switch the graph view to "Classes". You should see something like this:
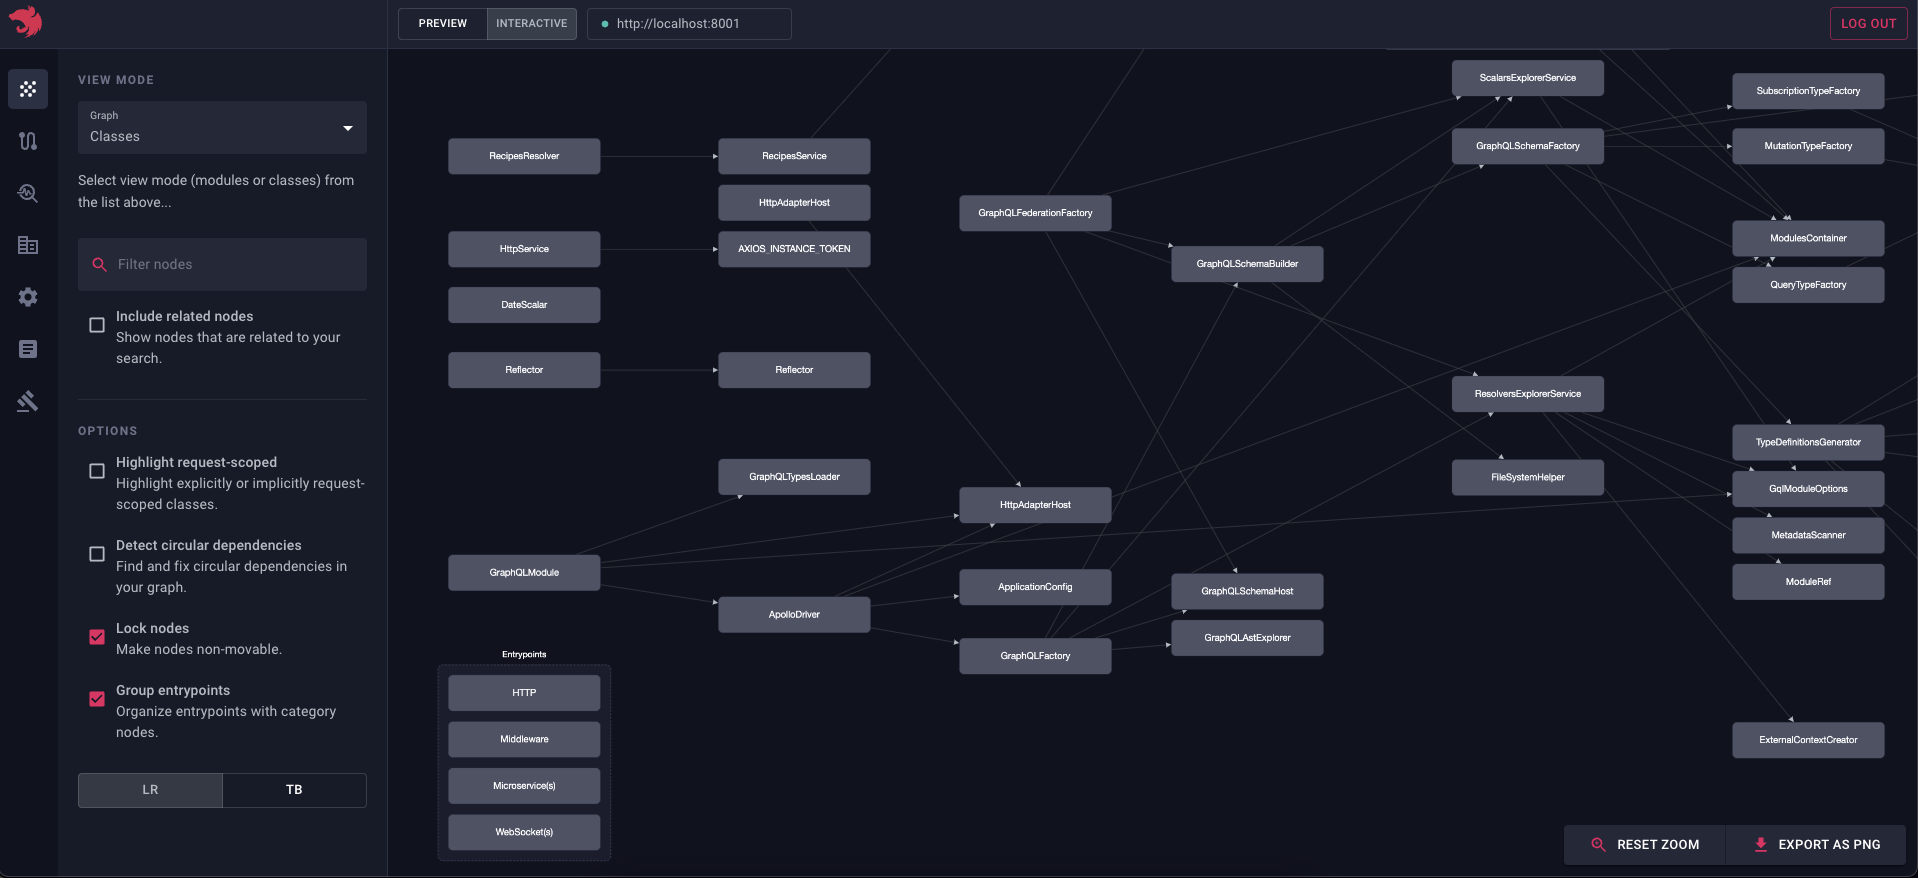
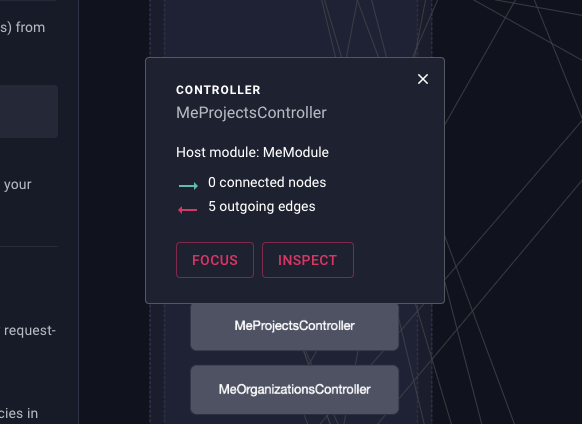
Click any node to open a popup with a "Focus" button that isolates it on the graph, or use the search bar in the sidebar to jump to a specific node.
Hint Clicking Inspect takes you to the /debug page with that node preselected, which is useful for digging into a specific provider or controller.
Hint Need a snapshot for docs or a pull request? Click Export as PNG in the bottom-right corner of the graph.
The sidebar controls let you narrow down edge proximity, which helps you zoom in on a specific branch of your application:
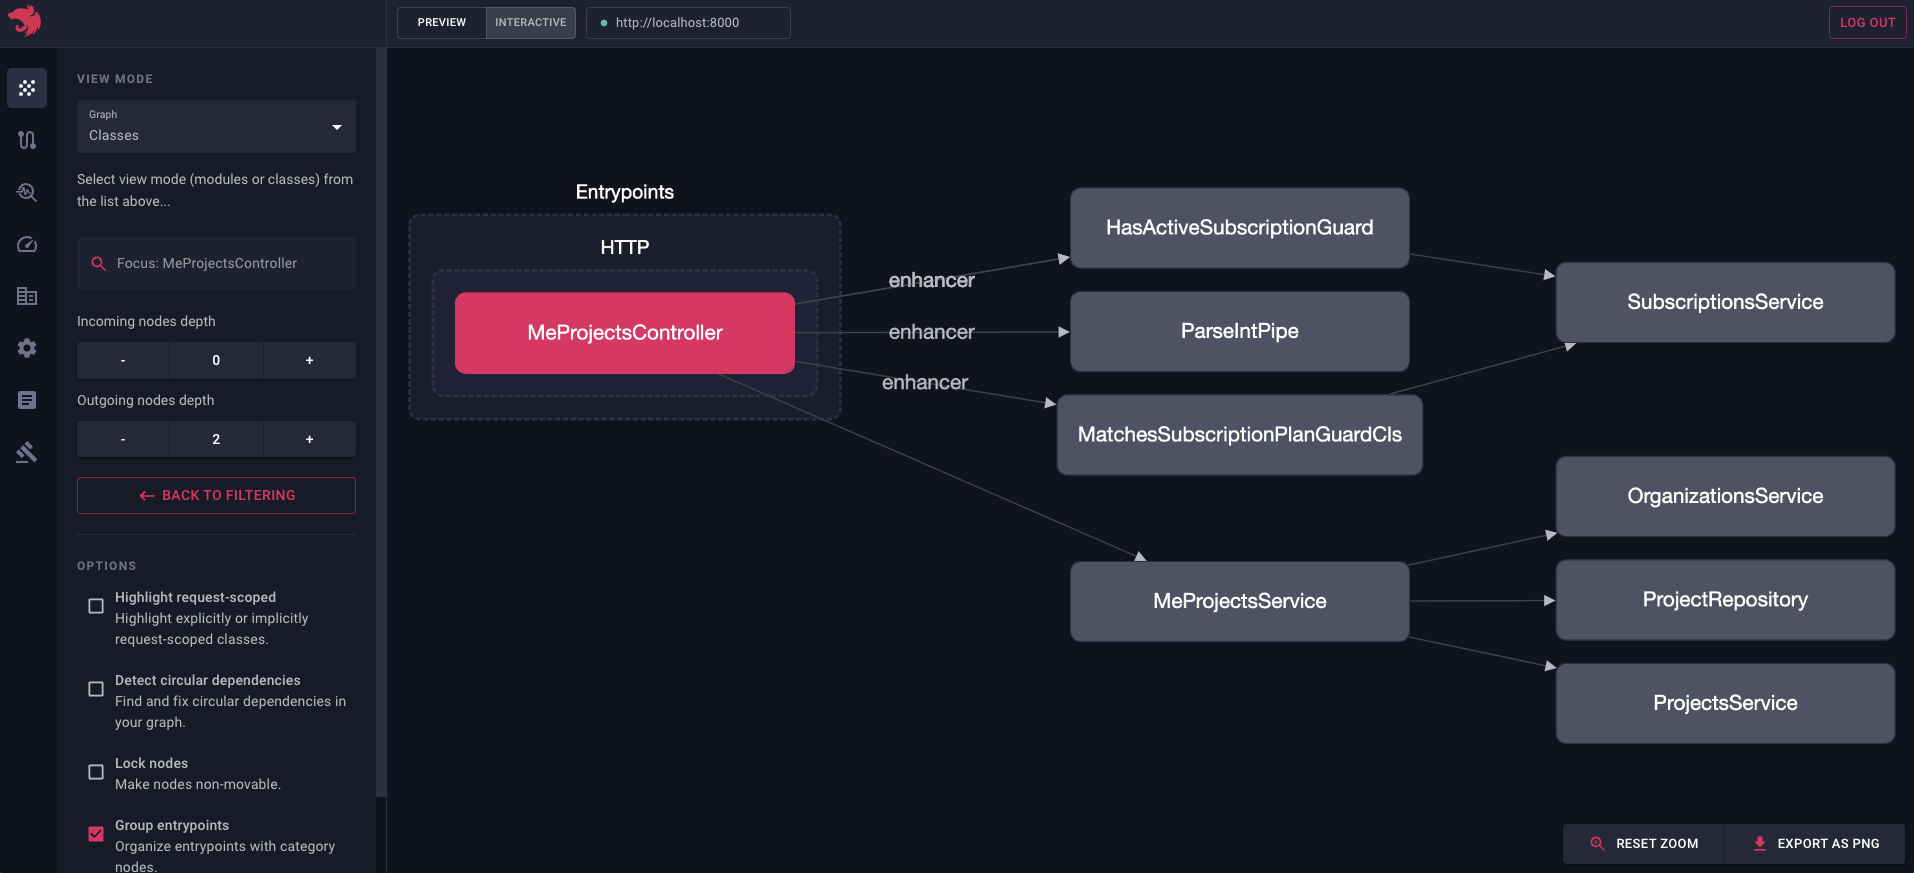
This is a great way to onboard new team members by showing them exactly how the application fits together. It's equally useful when you extract a module (say, TasksModule) along with all of its dependencies before splitting a large application into smaller services.
Everything in Graph Explorer stays in sync with your running application: refresh, and any change you've made to your modules or providers is reflected instantly. There's no build step or separate documentation to keep up to date; the graph is the documentation.
See Graph Explorer in action:
Debugging "Cannot resolve dependency" errors#
Note Available for @nestjs/core 9.3.10 and above.
If you've worked with Nest for a while, you've probably run into the "Cannot resolve dependency" error. It's often the first error a new team member sees, and on a large application it can be hard to track down: the stack trace tells you what's missing, but not why, or where in a deeply nested provider chain the wiring broke. Devtools turns this from a guessing game into a quick, visual diagnosis.
Start by updating the bootstrap() call in main.ts:
bootstrap().catch((err) => {
  writeFileSync('graph.json', PartialGraphHost.toString() ?? '');
  process.exit(1);
});
HintPartialGraphHostis exported from@nestjs/core, andwriteFileSyncfromnode:fs.
You also need to set abortOnError to false:
const app = await NestFactory.create(AppModule, {
  snapshot: true,
  abortOnError: false, // <--- THIS
});
From now on, whenever your application fails to bootstrap with a "Cannot resolve dependency" error, it writes a graph.json file (a partial graph) to your project root. Drag and drop the file into Devtools (switch from "Interactive" to "Preview" mode first) to see exactly where things went wrong:
Once uploaded, you'll see the graph along with a dialog summarizing what happened:
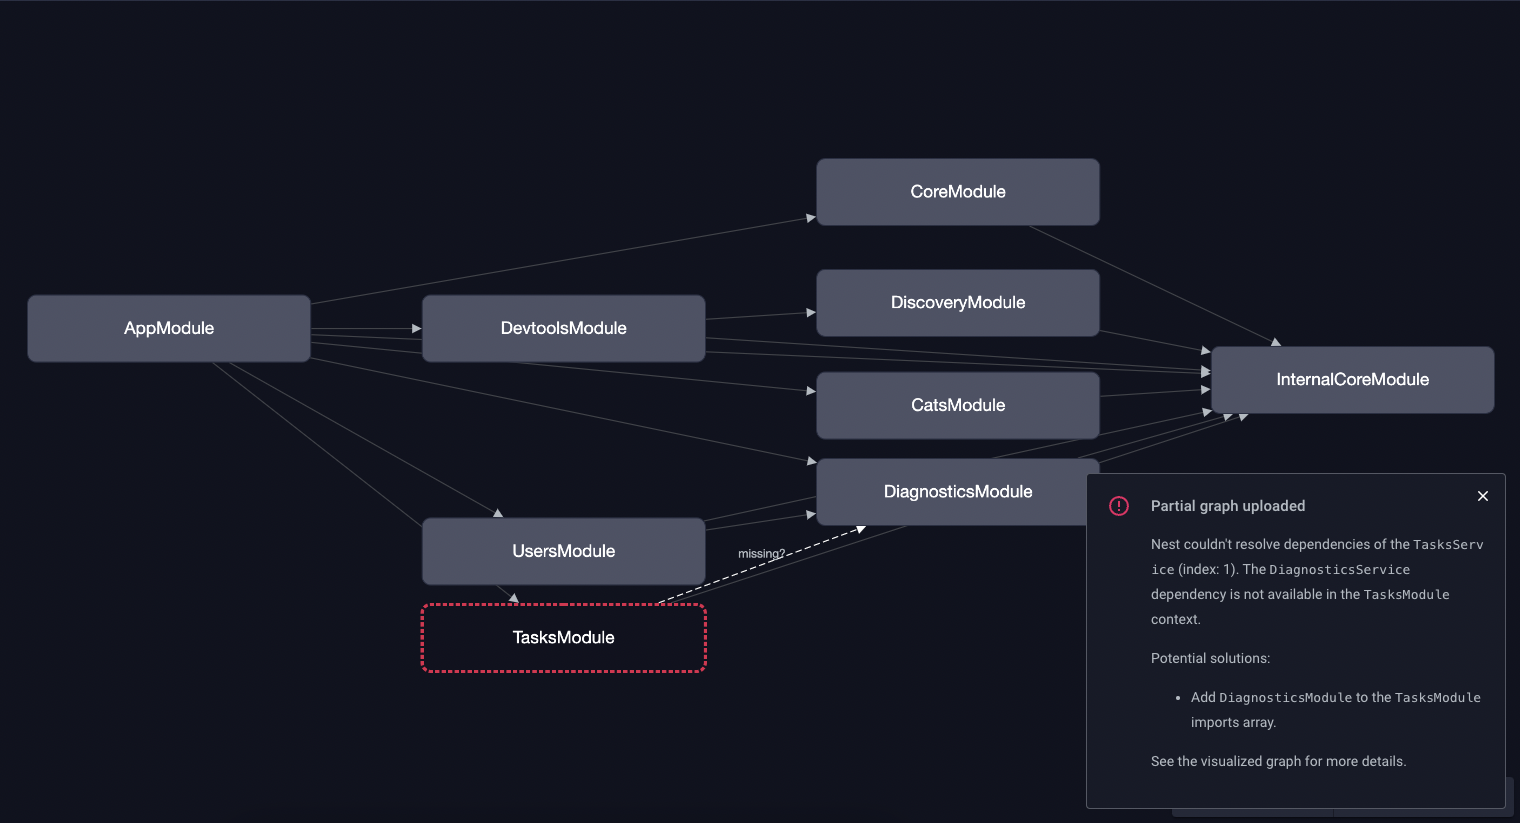
The highlighted TasksModule is the one to look into, and the dialog gives you pointers on how to fix it.
Switching to the "Classes" view tells the full story:
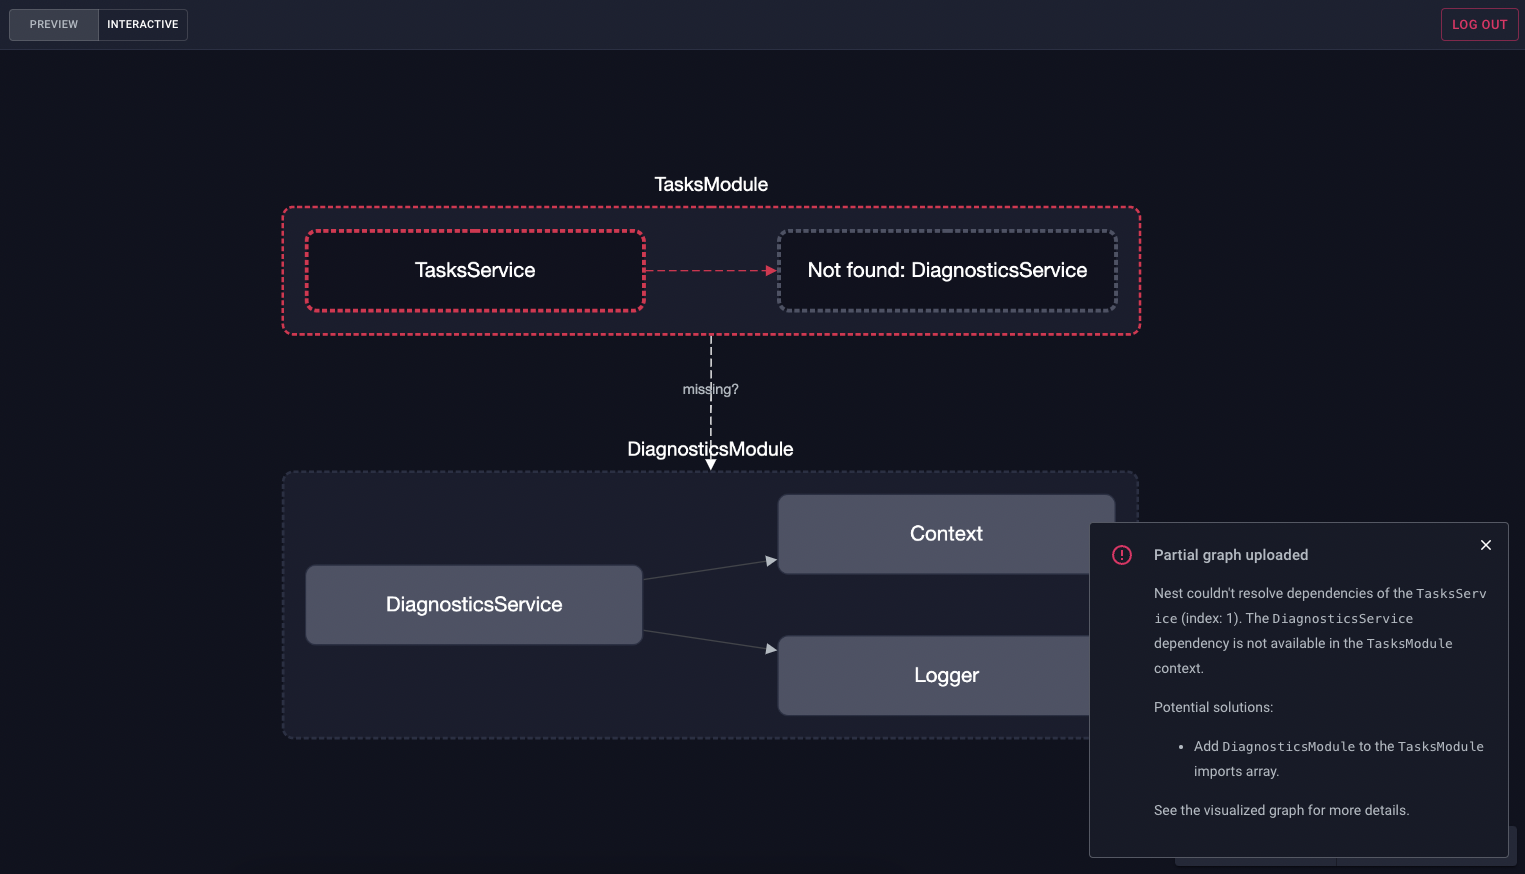
The graph makes it clear: DiagnosticsService, which TasksService depends on, isn't available in the TasksModule context. The fix is to import DiagnosticsModule into TasksModule.
What would otherwise be a slow process of manually tracing imports across several files, hoping you didn't miss one, turns into a couple of clicks. It's a small workflow change, but it adds up quickly on a codebase with dozens of modules.
Routes explorer#
The Routes explorer page shows every entrypoint your application registers:
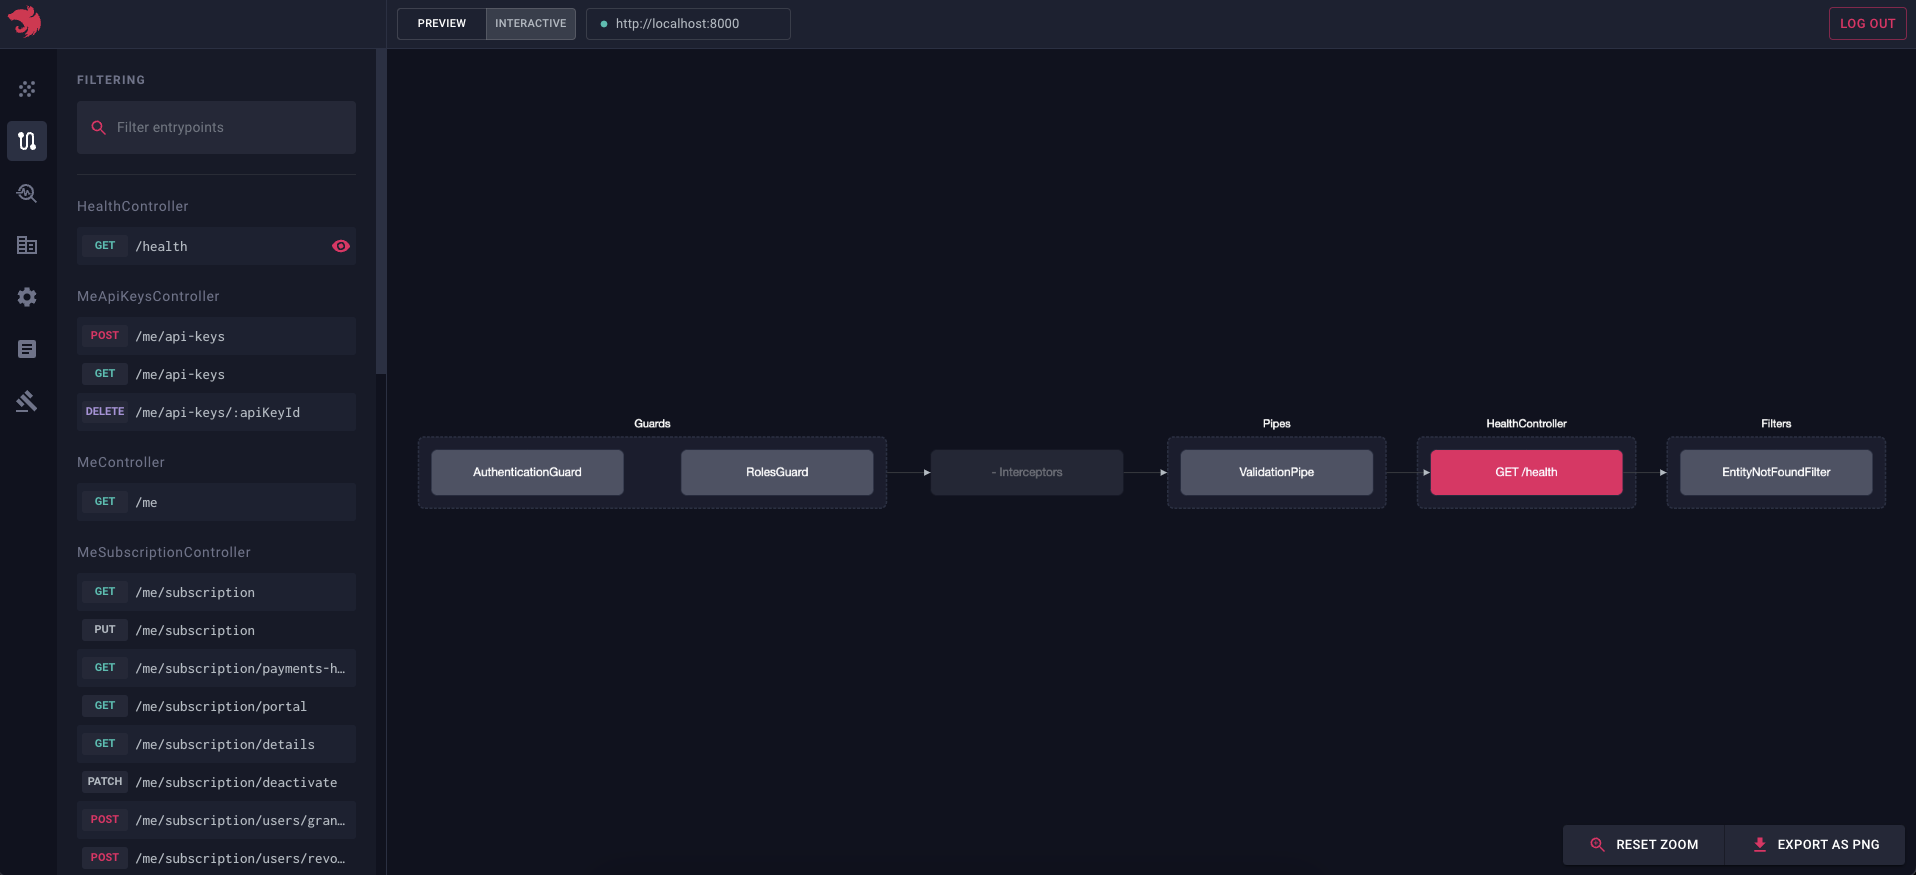
Hint This page isn't limited to HTTP routes. It also covers WebSockets, gRPC, GraphQL resolvers, and more.
Entrypoints are grouped by their host controllers, and you can use the search bar to jump to the one you're after.
Click any entrypoint to reveal a flow graph of its full execution path: every guard, interceptor, and pipe bound to that route. It's the fastest way to understand how a request travels through your application, or to find out why a specific guard, interceptor, or pipe isn't running when you expect it to.
This view pays off most on applications that have grown organically, where the same guard might be applied at the controller level in one place and per route in another. Instead of reading through decorators scattered across the codebase, you get the actual, resolved execution order for that route.
Playground#
To run code against your application without redeploying, open the Playground page:
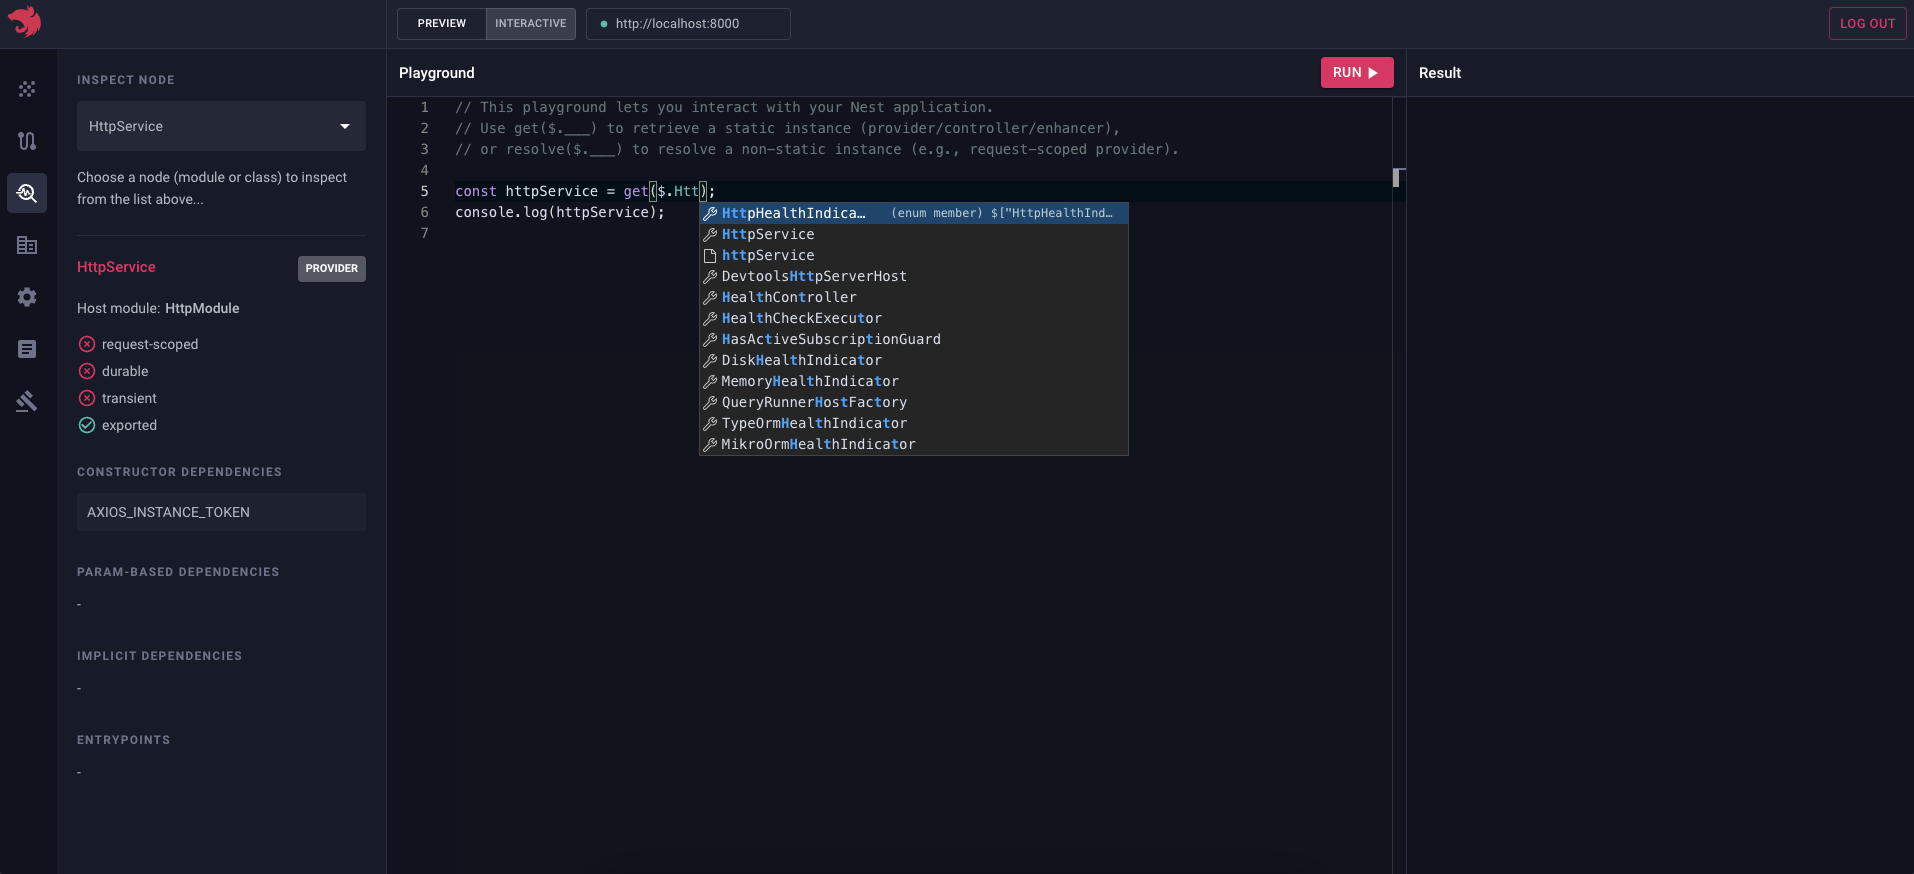
The Playground lets you test and debug endpoints in real time, so you can track down issues without reaching for a separate HTTP client. You can bypass the authentication layer entirely, skipping the extra login step or a dedicated test account. For event-driven applications, you can trigger events directly from the Playground to see exactly how your application responds.
Anything your code logs is streamed to the Playground's console, so you always know what's happening under the hood.
Run code on the fly and see the results instantly, with no rebuilds and no server restarts.
Hint Playground requests are authenticated with a sandbox session token.DevtoolsModulegenerates a new token each time the application starts and prints it to the console (Sandbox session token: ...). Provide this token to Devtools to run code in the Playground.
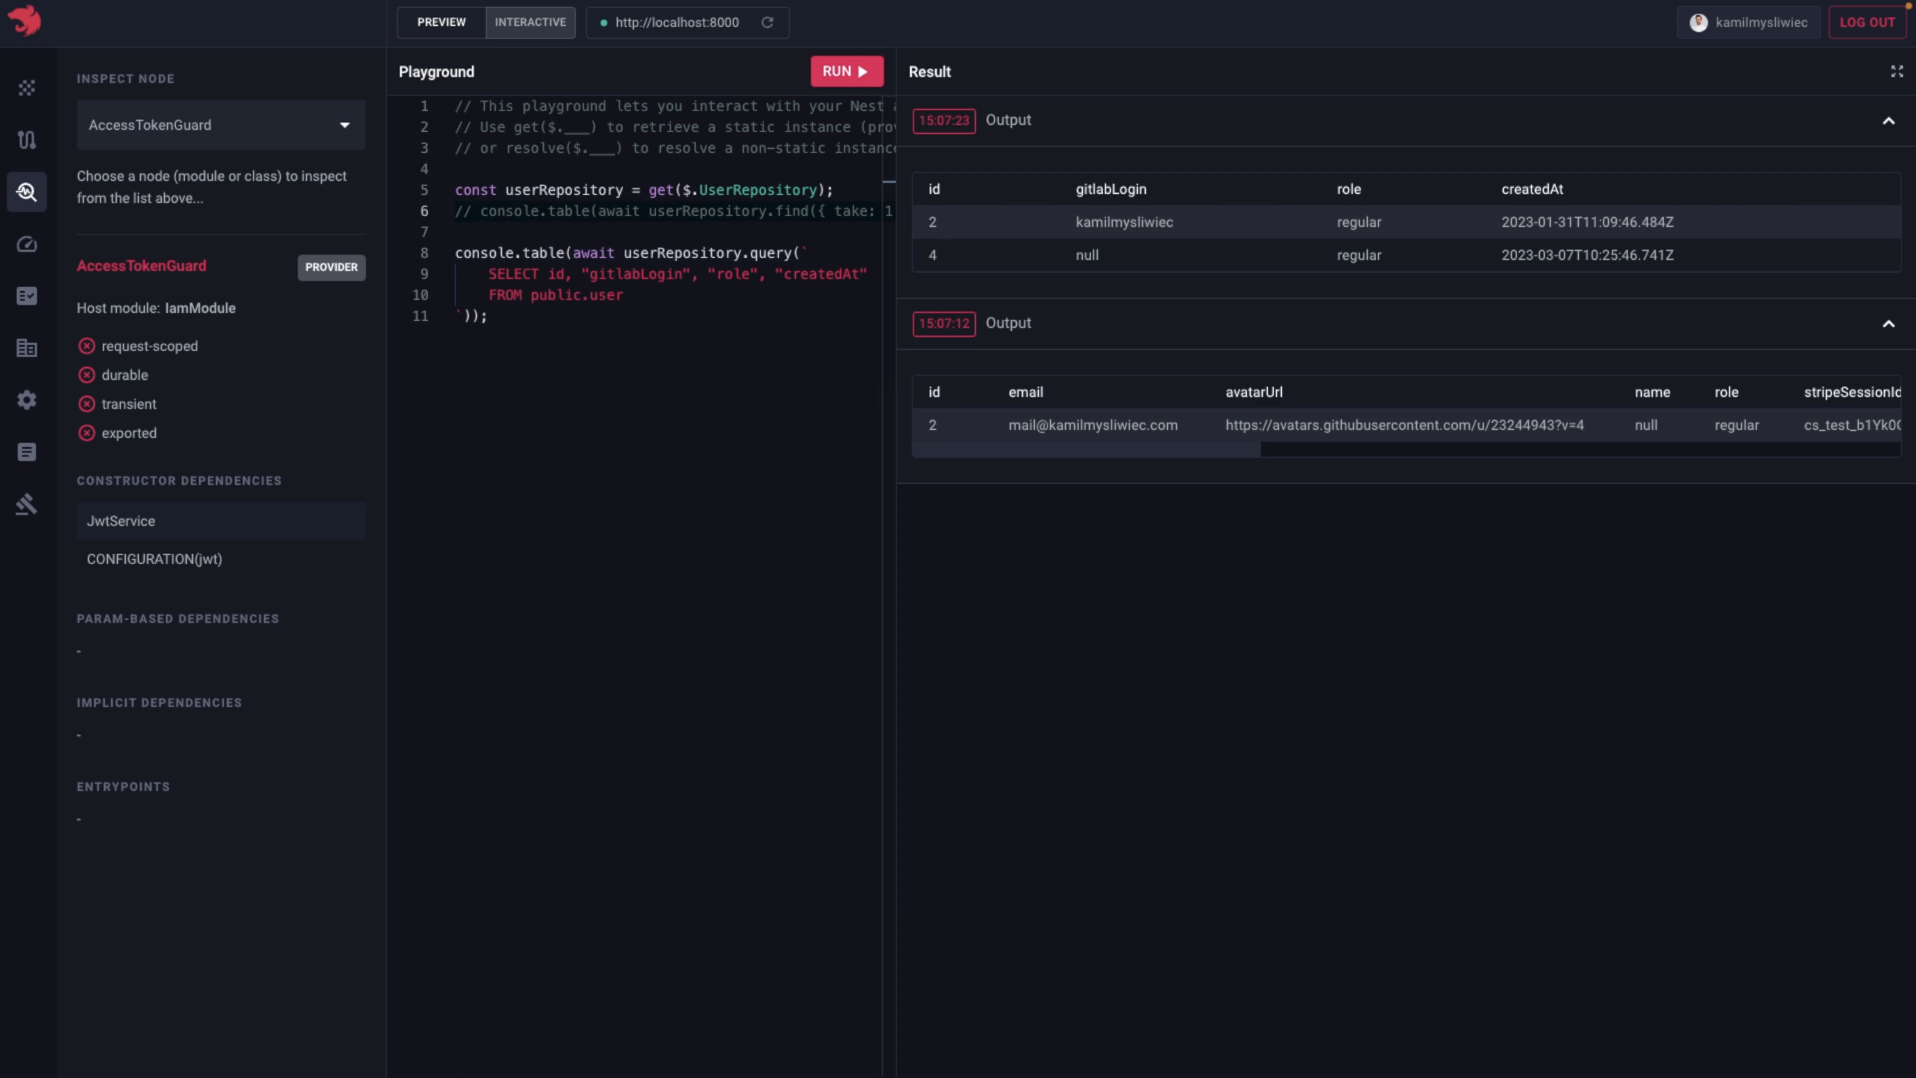
Hint Useconsole.table()(ortable()) to pretty-print an array of objects.
See the Playground in action:
Bootstrap performance analyzer#
To find out what's slowing down your application's startup, open the Bootstrap performance page. It lists every class node (controllers, providers, enhancers, and more) along with its instantiation time:
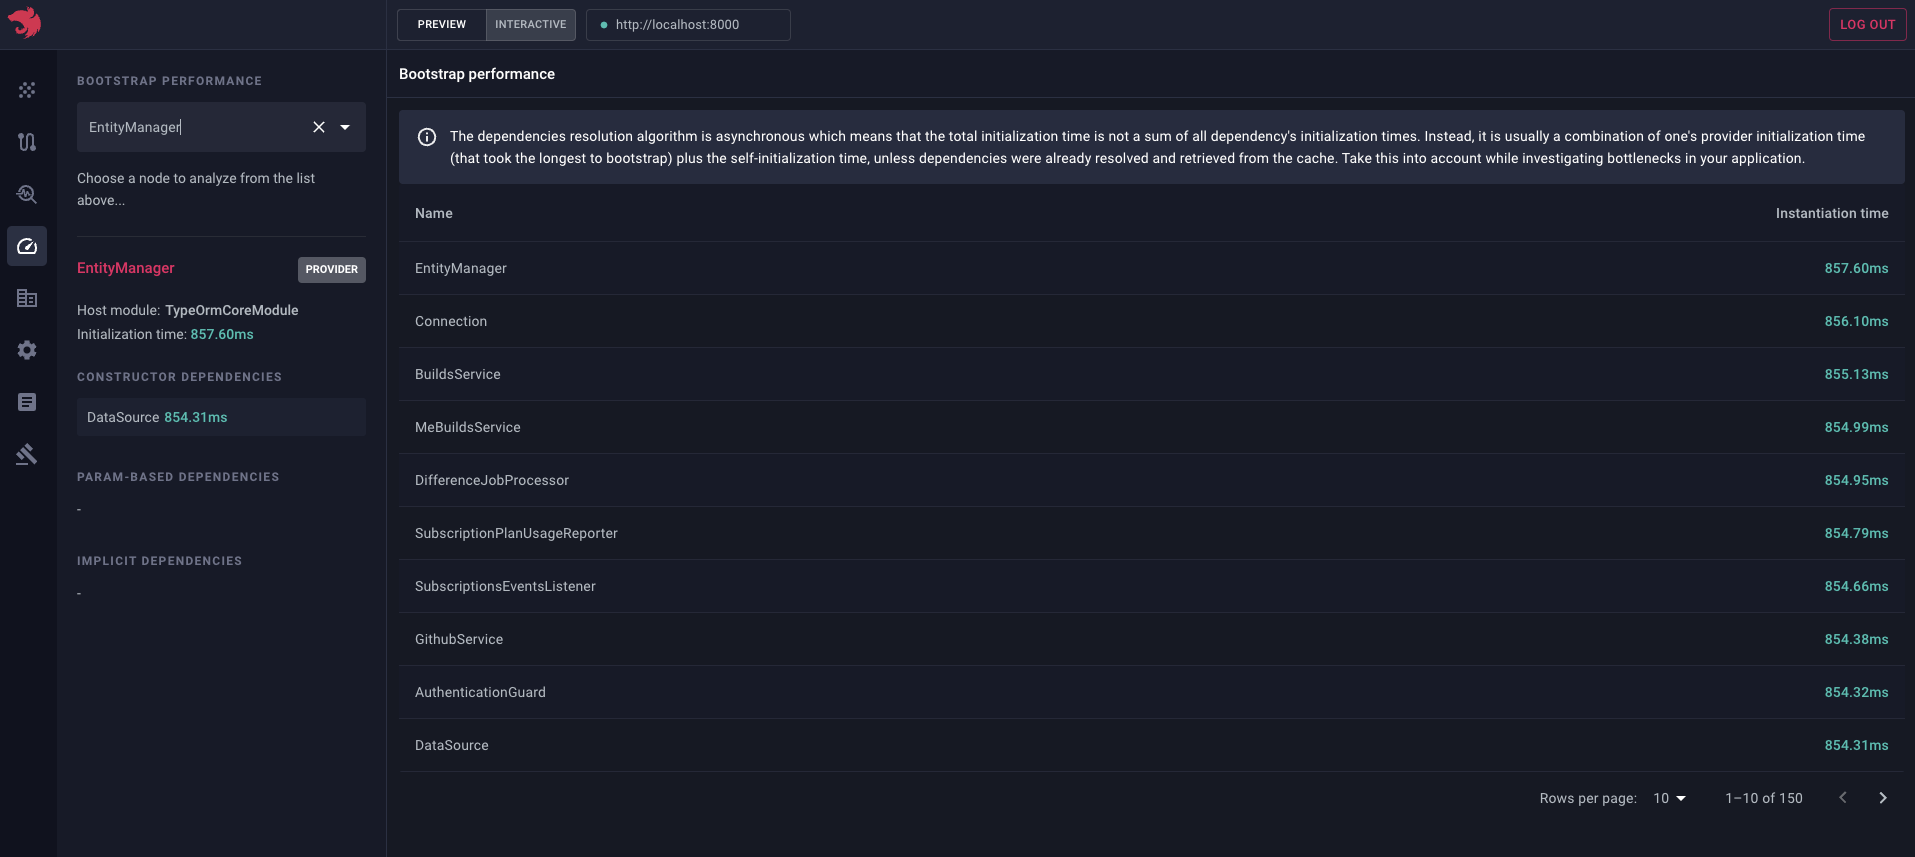
It's the quickest way to spot the slowest parts of your bootstrap process. This matters most when startup time is on the critical path, such as in serverless environments where every millisecond counts.
Slow bootstraps usually have a few common causes: heavy synchronous work inside a constructor, a provider awaiting a slow external call in onModuleInit, or a module instantiating far more dependencies than it needs. Sorted by instantiation time, this page makes those outliers obvious at a glance, without sprinkling console.time() calls throughout your codebase.
Audit#
Devtools automatically analyzes your serialized graph and surfaces errors, warnings, and hints that deserve your attention. You'll find them on the Audit page:
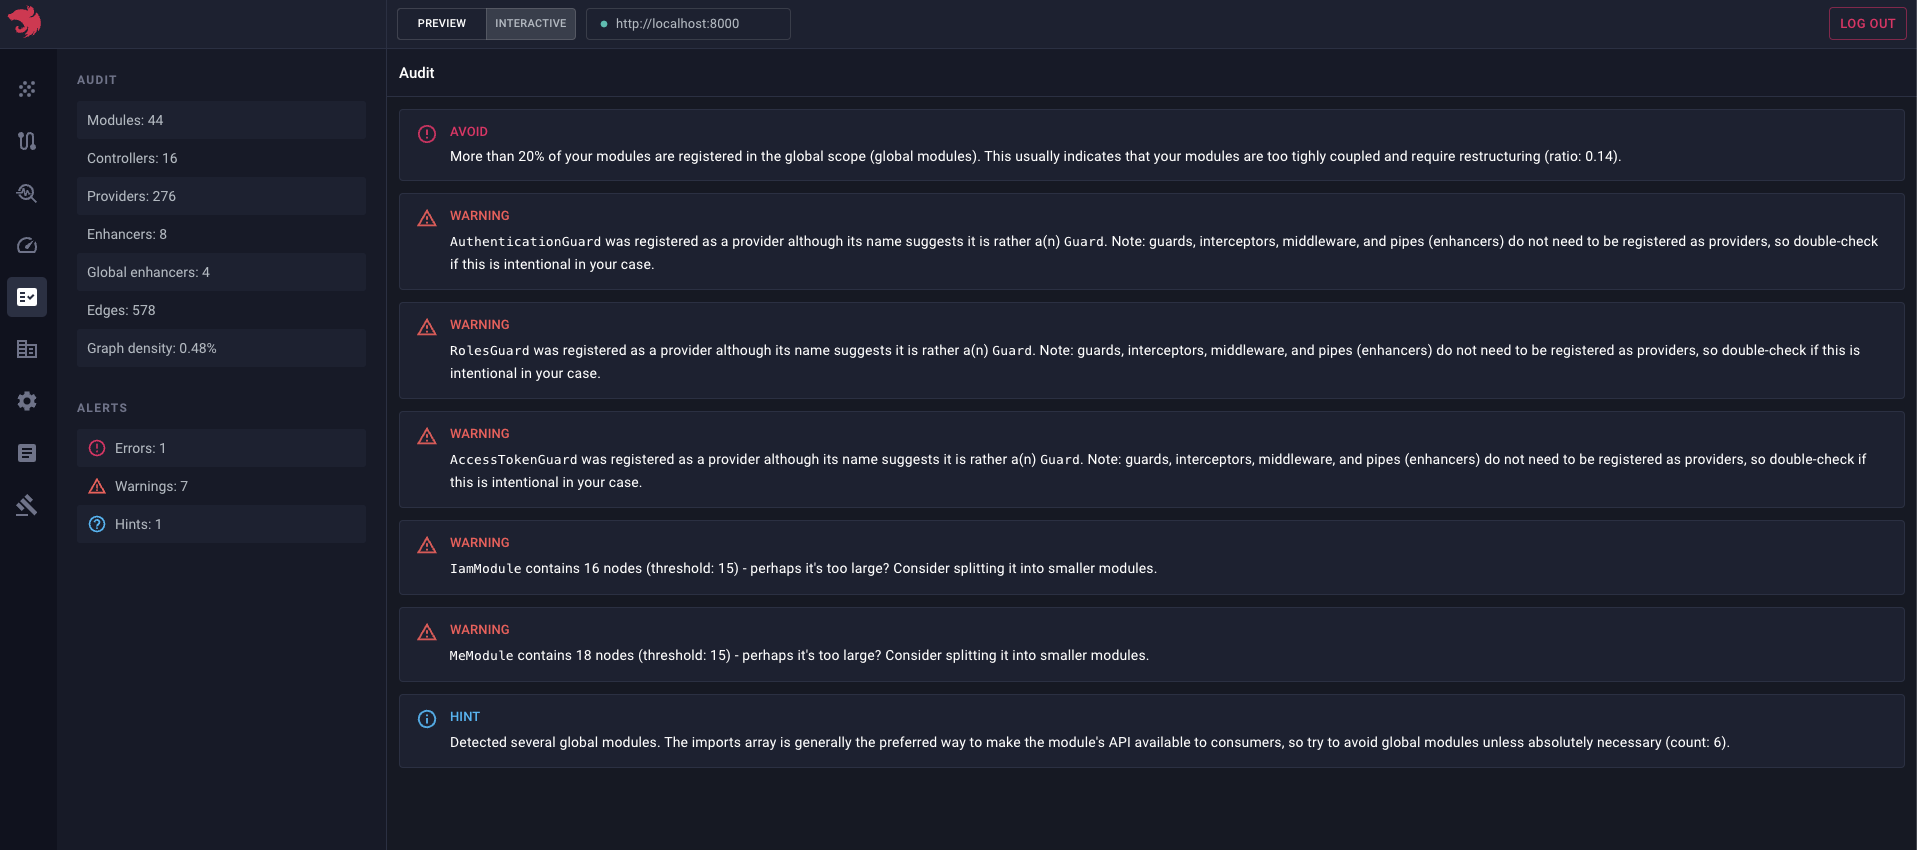
Hint The screenshot above shows only a sample of the available audit rules.
Think of it as a linter for your application's architecture: a fast way to catch issues before they catch you. Some of the built-in rules flag problems you'd otherwise discover the hard way: a controller carrying far more routes than its neighbors, a module pulling in an unusually large number of dependencies, a provider named SomethingGuard that was never registered as a guard, or a request-scoped provider that's a strong candidate for durable providers. Your test suite won't catch any of these, but they are exactly the kind of thing that slows a codebase down over time.
Preview static files#
To save a serialized graph to a file, use the following code:
await app.listen(3000); // OR await app.init()
writeFileSync('./graph.json', app.get(SerializedGraph).toString());
HintSerializedGraphis exported from@nestjs/core.
Then drag and drop (or upload) the file:
This is useful when you want to share a graph with a coworker, attach it to a bug report, or analyze it offline, without running your application.