
Distributed tracing
A trace is everything your applications recorded under a single trace id: the request or job that started it, and every span underneath. Within a single service this is automatic. The SDK generates a trace id when work starts, and every span underneath, including ones you add manually with TracerService, inherits it.
Across services, it depends on the channel. HTTP calls, queue jobs, and (on @nestjs/microservices 12.0.4 or later) the TCP and Redis transports carry the trace id on their own; gRPC and the other microservice transports need it forwarded. A single user action that touches more than one service (an API call that fans out to a gRPC service, or a message sent to another application over a microservice transport) shows up as one trace in your dashboard only if every service involved uses the same trace id. Otherwise, each service mints its own via traceIdGenerator, and the action shows up as several disconnected traces, one per service.
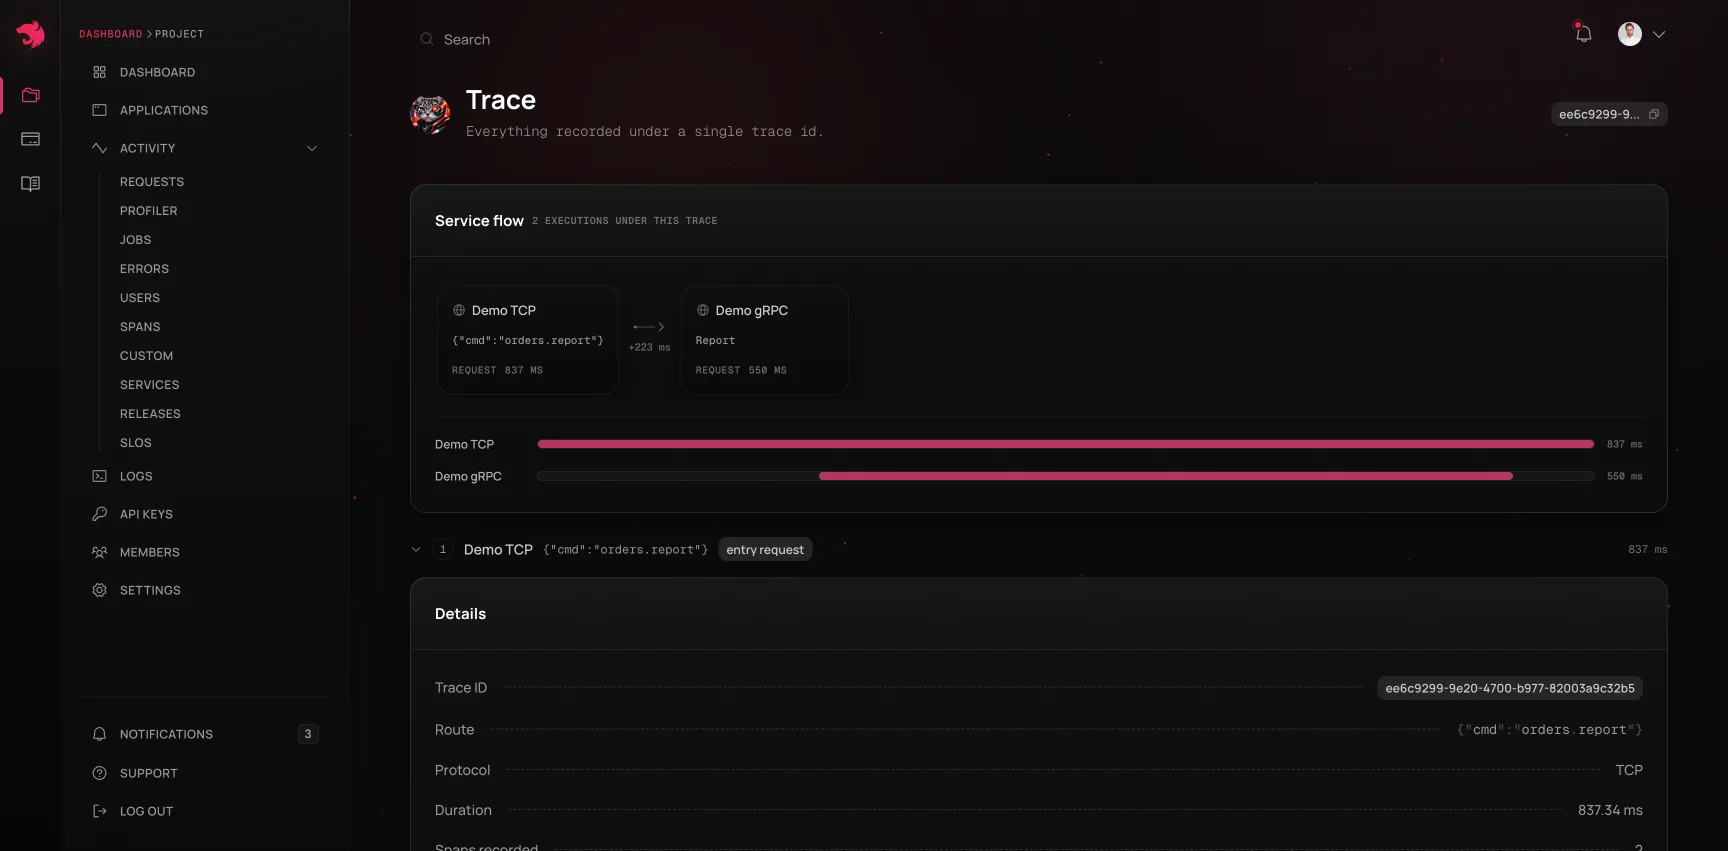
Where forwarding is needed, it is application code, not a dashboard setting, and the pattern is always the same: the caller puts its current trace id on whatever channel the protocol has, and the callee's traceIdGenerator reads it back out. This page shows how for each transport.
Reading the current trace id#
To forward a trace id downstream, a service first reads the one it's currently running under. TracerService.currentTraceId() returns it:
import { Injectable } from '@nestjs/common';
import { TracerService } from '@nestjs/observe';

@Injectable()
export class OrdersService {
  constructor(private readonly tracerService: TracerService) {}

  async report(orderId: string) {
    const traceId = this.tracerService.currentTraceId();
    // ...forward traceId to the next service
  }
}
It reads from the same context store as getAttribute()/setAttribute(), but unlike those it doesn't throw outside a traced context. It returns null instead, so code that forwards a trace id from startup hooks or other untraced paths doesn't need a try/catch. If your code can run outside a trace, check for null before setting a header.
HTTP to HTTP#
HTTP propagation is automatic in both directions. On the way in, the default traceIdGenerator adopts a well-formed x-request-id header and otherwise mints a time-ordered UUID (v7). On the way out, the SDK adds the current trace id as x-request-id to outbound requests that don't already carry one, so a call from one instrumented service to another lands in the same trace with no application code.
Outbound propagation covers fetch and undici, including the HTTP client, on every supported Node version, and clients built on node:http (axios, got, @nestjs/axios) on Node 22.12 and later, the first release that lets a header be added after the request object is created. To limit which hosts receive the header, or switch it off, see outgoing.http.propagateTraceId.
On an older Node version with an axios-based client, register a request interceptor once to forward the id yourself:
@Module({
  imports: [HttpModule],
})
export class OrdersModule implements OnModuleInit {
  constructor(
    private readonly httpService: HttpService,
    private readonly tracerService: TracerService,
  ) {}

  onModuleInit() {
    this.httpService.axiosRef.interceptors.request.use((config) => {
      config.headers['x-request-id'] = this.tracerService.currentTraceId();
      return config;
    });
  }
}
Hint Many reverse proxies and load balancers (nginx, Envoy, AWS ALB) can set x-request-id on every inbound request. When they do, the trace id in your dashboard matches the request id in your proxy's access logs.
gRPC#
gRPC has no headers, only metadata. The caller attaches the trace id as metadata, and the gRPC service overrides traceIdGenerator to read it back out, since the default generator doesn't read gRPC metadata:
import { Metadata } from '@grpc/grpc-js';

const metadata = new Metadata();
const traceId = this.tracerService.currentTraceId();
if (traceId) {
  metadata.set('x-request-id', traceId);
}
this.heroesService.findOne({ id: 1 }, metadata);
import { randomUUID } from 'node:crypto';

// gRPC service - passed to createObserveModule(), not forRoot()
export const { ObserveModule, ObserveInstrument } = createObserveModule({
  traceIdGenerator: (call: any) => {
    const inbound = call.metadata?.get?.('x-request-id')?.[0];
    return typeof inbound === 'string' && inbound.length > 0
      ? inbound
      : randomUUID(); // no id was propagated - this call started its own trace
  },
});
See the gRPC chapter for how metadata is read and written on both sides of a call.
TCP, Redis, NATS, and other microservice transports#
On @nestjs/microservices 12.0.4 or later, the TCP and Redis transports carry packet metadata, and @nestjs/observe 0.3.0 or later uses it. The SDK attaches the current trace id to every packet sent through a ClientProxy registered as a provider (e.g., with ClientsModule), and the default traceIdGenerator on the receiving side adopts it, so no application code is needed.
The other transports, and TCP and Redis on earlier versions, have no metadata channel, only a message payload. There, the trace id has to travel as a field inside the payload itself:
this.client.send('orders.report', {
  ...payload,
  traceId: this.tracerService.currentTraceId(),
});
import { randomUUID } from 'node:crypto';

// receiving service
export const { ObserveModule, ObserveInstrument } = createObserveModule({
  traceIdGenerator: (ctx: any) => ctx.getData()?.traceId ?? randomUUID(),
});
The generator receives the transport's context object, so the same code works for request-response (send()) and event-based (emit()) messages.
Warning The sametraceIdGeneratoris called with HTTP requests and RPC contexts alike. In a hybrid application that serves both HTTP and a microservice transport, write the generator defensively: check forheadersfirst, then fall back to the payload.
GraphQL#
No extra configuration is needed when the GraphQL server sits behind the same service's HTTP layer. It joins whatever trace the HTTP agent already opened for that request, which may itself have been propagated via x-request-id as described above. Only operations with no enclosing HTTP trace, such as a subscription over a raw WebSocket, need separate handling, and there's currently no built-in propagation hook for that case.
Queue jobs (BullMQ and Bull)#
Queue propagation is automatic. When a job is added from inside a traced operation (a request handler, an RPC handler, another job), the SDK stamps the current trace id onto the job's options, and the processor that picks the job up runs under that id instead of minting its own. The request and every job it enqueued render as one trace, with no application code involved:
@Post()
async create(@Body() dto: CreateOrderDto) {
  const order = await this.ordersService.create(dto);
  // The job inherits this request's trace id
  await this.ordersQueue.add('send-confirmation', { orderId: order.id });
  return order;
}
This works the same way for @nestjs/bullmq and @nestjs/bull, for add() and addBulk(), and whether the worker runs in the same process as the producer or in a separate service: the id travels through Redis with the job. A retried job keeps the id it was enqueued with, so every attempt lands in the same trace.
Two cases deliberately start a trace of their own:
- Repeatable jobs and
@nestjs/schedulehandlers. A schedule outlives the operation that registered it, so each firing is its own trace rather than part of an ever-growing trace attached to whichever request set the schedule up. - Jobs added outside any traced operation, e.g., from a bootstrap hook or a plain script. There is no trace to inherit.
Hint The trace id is stored under the observeTraceId job option. To attach a job to a trace the SDK did not see (e.g., one enqueued by a non-Nest producer), set that option yourself when adding the job.
Warning Trace inheritance for jobs requires @nestjs/observe 0.3.0 or later on both the service that adds the job and the service that processes it. With an older producer, jobs carry no id and each run opens its own trace, as before.
What a trace looks like in the dashboard#
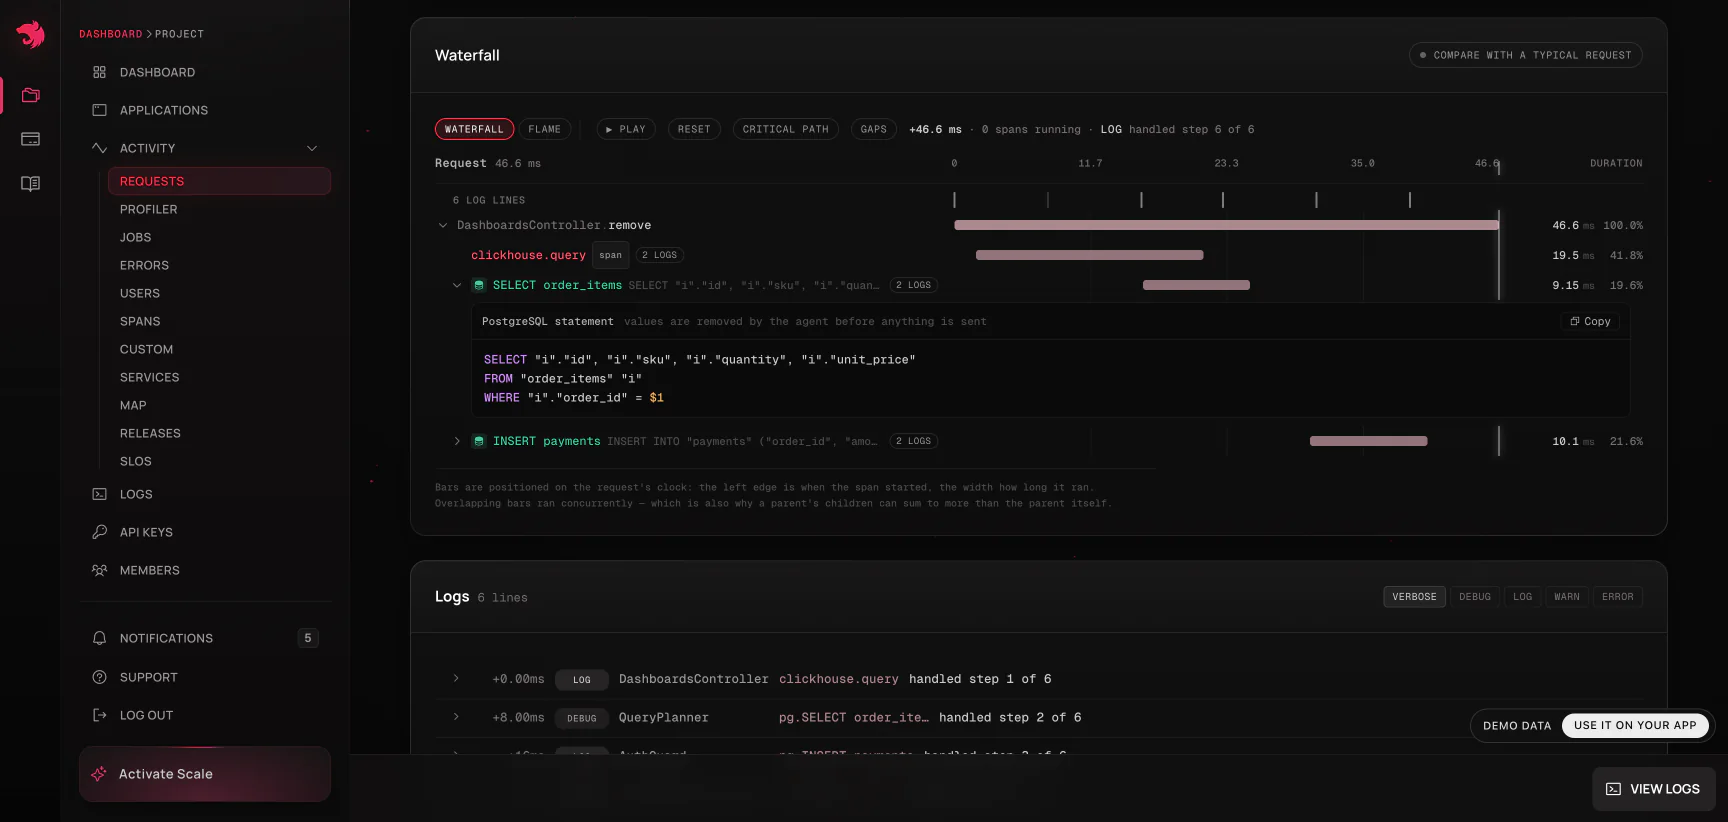
Once services agree on a trace id, the trace detail page renders every execution that ran under it, across services, requests, and jobs, as one waterfall: nesting depth as indentation, duration as bar length, and horizontal position as when the span ran. When reading it, keep the following in mind:
- Self time is the number that matters. A span's duration minus the time its children account for is the time the span spent in its own code. Ranking by total duration always puts the controller at the top (it contains everything); ranking by self time surfaces the repository call that actually burned the time. Every execution page carries a spans table sorted this way.
- Overlapping children are flagged. When a span's children sum to more than the span's own duration, they ran concurrently (
Promise.all, a parallel fan-out) and the row says so. - Failing spans are marked, and the execution page leads with an error card for the first span that threw - class, message, the trimmed stack trace with the throwing frame marked, and the source lines around it when
sourceContextis on. - Logs sit on the trace's clock. With
forwardLogsenabled, each line is placed at its offset from the start of the trace and labeled with the span that was in flight when it was written; hovering a line marks that instant on the waterfall.
From any failed or unusually slow execution, the Copy agent prompt button packages the whole page (context, error, stack trace with source, top spans by self time, and logs) as a self-contained markdown prompt for a coding agent. See Dashboard.