
SDK
The @nestjs/observe SDK is what gets your application's requests, jobs, errors, logs, and traces into your NestJS Observe dashboard. It hooks into Nest's own request lifecycle - controllers, interceptors, resolvers, queue consumers - rather than bolting a generic Node.js agent onto the process, so most of what shows up in the dashboard needs no manual span wiring.
Hint Not sure it is worth the setup yet? The live demo shows what this instrumentation produces - traces, waterfalls, errors and jobs from a busy service - without installing anything.
Installation#
$ npm i @nestjs/observe
Warning The SDK requires@nestjs/corev11.1.4 or later (it relies on theinstrumentapplication option introduced in that release), and@nestjs/graphqlv13.4.4 or later if your application uses GraphQL. Earlier versions lack the hooks the SDK needs.
Quick start#
The integration takes three steps. First, call createObserveModule() once, typically in app.module.ts or another root-level file. It returns a matched pair - a Nest module and an instrument hook - bound to the same configuration:
import { Module } from '@nestjs/common';
import { createObserveModule } from '@nestjs/observe';
import { AppController } from './app.controller.js';
import { AppService } from './app.service.js';

export const { ObserveModule, ObserveInstrument } = createObserveModule();

@Module({
  imports: [
    ObserveModule.forRoot({
      appKey: process.env.OBSERVE_APP_KEY!,
      appSecret: process.env.OBSERVE_APP_SECRET!,
      serviceId: 'cats-app',
    }),
  ],
  controllers: [AppController],
  providers: [AppService],
})
export class AppModule {}
Second, import ObserveModule.forRoot() into your root module with at least a serviceId (shown above). Third, pass ObserveInstrument to NestFactory.create() so the SDK attaches to the application before it starts handling traffic:
import { NestFactory } from '@nestjs/core';
import { AppModule, ObserveInstrument } from './app.module.js';

async function bootstrap() {
  const app = await NestFactory.create(AppModule, {
    instrument: ObserveInstrument,
  });
  await app.listen(process.env.PORT ?? 3000);
}
await bootstrap();
Fastify WithFastifyAdapter(or any explicit adapter), the adapter takes the second argument, so the application options - and thereforeinstrument- move to the third:const app = await NestFactory.create<NestFastifyApplication>( AppModule, new FastifyAdapter(), { instrument: ObserveInstrument }, );Passing the options object as the second argument alongside an adapter silently drops them, and the SDK never attaches.
That completes the integration. Once the application receives traffic, requests, errors, and traces appear in your project's dashboard within moments, with no exporter to configure and no schema to design. The same instrument option is accepted by NestFactory.createMicroservice() and NestFactory.createApplicationContext(), so workers and standalone applications are instrumented the same way.
HintcreateObserveModule()itself takes an options object that controls how trace ids are generated, how error source context is captured, and which providers are instrumented - see Trace correlation and Error source context below. Everything else is configured throughObserveModule.forRoot().
Configuring the module#
Beyond the credentials in the quick start, these options decide how the SDK identifies your application, where it sends what it records, and how much it tells you about itself.
Authenticating and identifying the application#
ObserveModule.forRoot({
  appKey: process.env.OBSERVE_APP_KEY!,
  appSecret: process.env.OBSERVE_APP_SECRET!,
  serviceId: 'cats-app',
  serviceVersion: process.env.GIT_SHA,
});
| Option | Type | Default | Description |
|---|---|---|---|
appKey | string | required | Generated from your project's API Keys page - see First project. Keep it out of source control. |
appSecret | string | required | Issued alongside appKey from the same page. Keep it out of source control. |
serviceId | string | required | Identifies this application in your dashboard. If you run multiple instances of the same service, use a value unique per instance (hostname, container id) to tell them apart in the Profiler. |
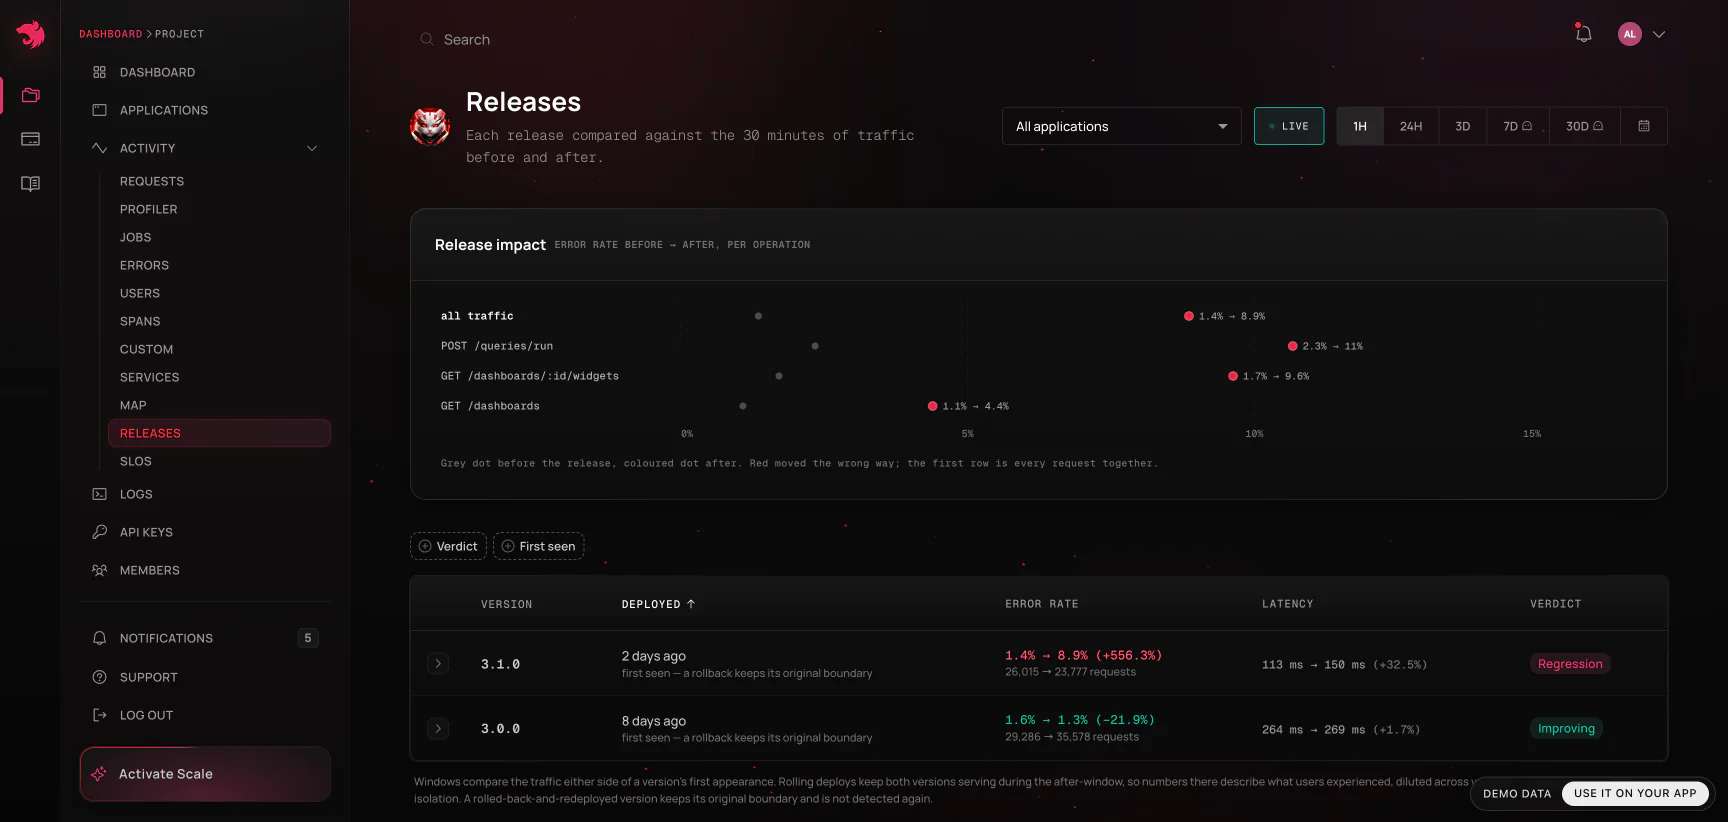
serviceVersion | string | - | Identifies the deployment - a semantic version, a commit hash, or any other identifier. Every request and job records the version that served it, which is what powers the Releases view. |
serviceVersion is optional but strongly recommended. It lets the dashboard compare each version of an application against the one before it (error rate, latency, and throughput side by side), so a regression introduced by a deploy is visible immediately rather than buried in a week-long chart.
Asynchronous configuration#
When the credentials come from a configuration provider rather than directly from process.env, use forRootAsync(). It accepts the same useFactory/inject, useClass, and useExisting shapes as every other Nest dynamic module (a class implements ObserveOptionsFactory with a createObserveOptions() method), plus extraProviders and global:
ObserveModule.forRootAsync({
  imports: [ConfigModule],
  inject: [ConfigService],
  useFactory: (config: ConfigService) => ({
    appKey: config.getOrThrow('OBSERVE_APP_KEY'),
    appSecret: config.getOrThrow('OBSERVE_APP_SECRET'),
    serviceId: config.get('SERVICE_ID', 'cats-app'),
    serviceVersion: config.get('GIT_SHA'),
  }),
});
Collector endpoint#
ObserveModule.forRoot({
  // ...
  endpoint: 'https://observe-api.nestjs.com',
});
endpoint (default 'https://observe-api.nestjs.com') is the base URL of the collector. Telemetry and profiles share it, so the two can never point at different places. To override it without touching the config, set the OBSERVE_ENDPOINT environment variable; this is the usual way to point the SDK at a local or self-hosted collector.
Debugging the SDK itself#
ObserveModule.forRoot({
  // ...
  debug: true,
});
debug (default false) logs additional diagnostic information from the SDK to the console. Use it while getting instrumentation working, and turn it off in production.
Automatic instrumentation#
Everything in this section is recorded without any code of your own; installing the SDK is enough. The options only narrow it or switch it off.
Database queries and outbound HTTP#
Since @nestjs/observe 0.3.0, database queries and outbound requests appear as spans with no configuration, nested under the method that made them. A slow repository call shows which statement it was waiting on.
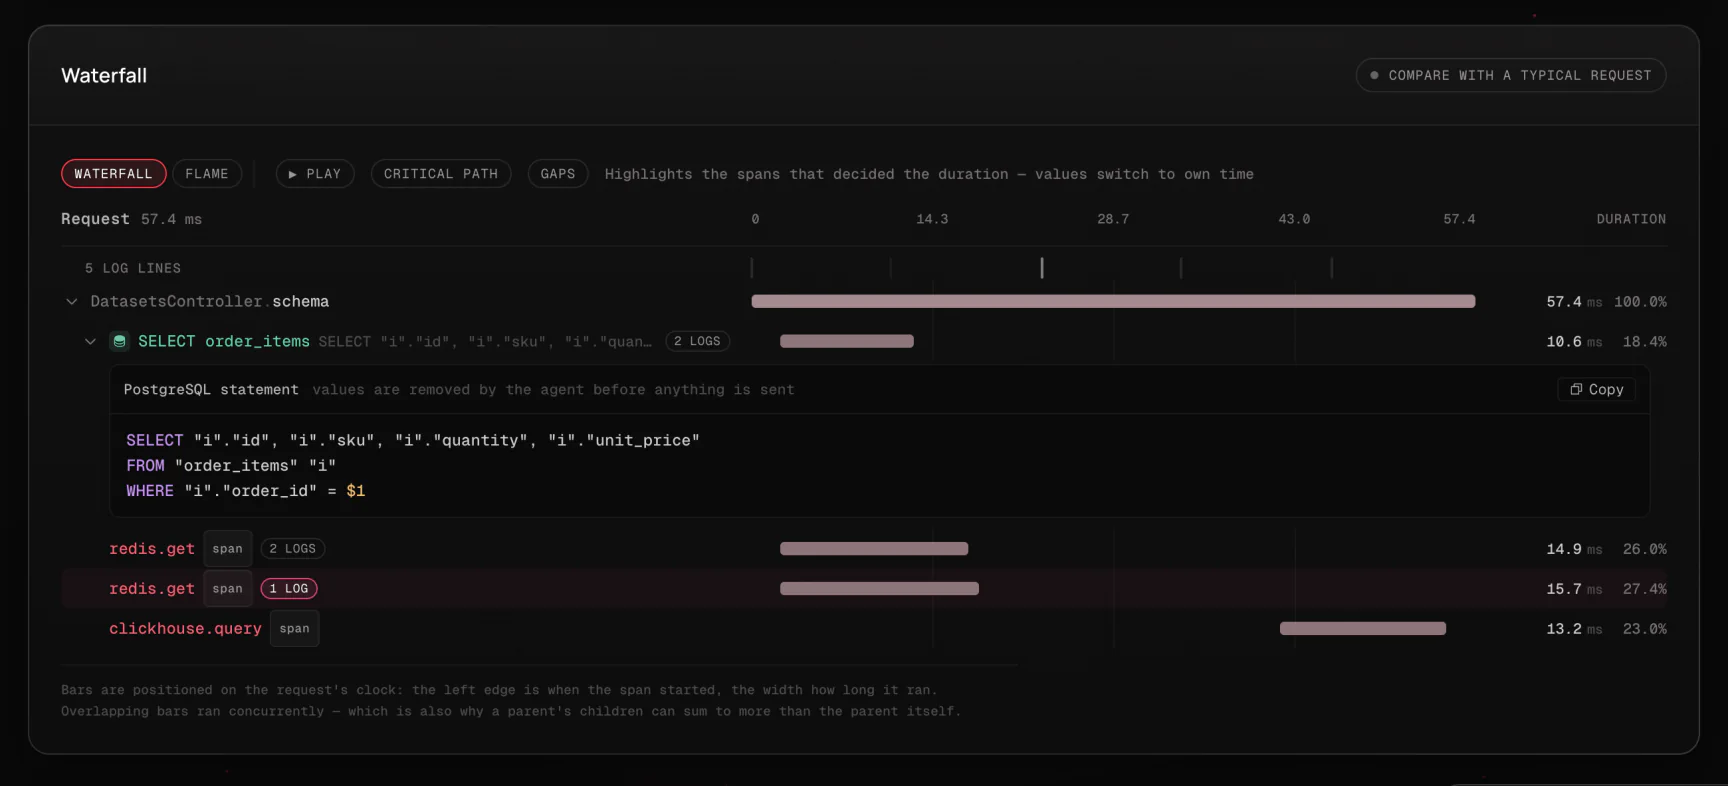
Databases are instrumented at the driver rather than the ORM: pg, mysql2 and mongodb are detected if your application already depends on them, which covers TypeORM, MikroORM, Drizzle, Mongoose, Knex, Sequelize, and Prisma's driver adapters without naming any of them. ORMs that ship their own nested copy of a driver (MikroORM and Mongoose do, whenever versions disagree) are handled too. The driver's own housekeeping (connection handshakes, authentication, pings) is not recorded. A query span is labeled with its verb and table (SELECT users) and carries the statement with every literal removed - strings, numbers, IN (...) lists, and comments are replaced before the span leaves the process, and bound parameters are never read at all. Repeated queries under one parent fold into a single node with a count, so an N+1 reads as SELECT order_items ×47 rather than 47 rows.
Outbound HTTP is read from Node's own diagnostics channels, so fetch, undici, and everything built on node:http (axios, got, most SDKs) are covered with nothing patched. The span is labeled GET api.example.com and carries the URL with sensitive query parameters masked. The SDK also sends the current trace id as x-request-id, which makes HTTP-to-HTTP tracing automatic.
ObserveModule.forRoot({
  // ...
  outgoing: {
    database: true,
    http: {
      ignore: (url) => url.startsWith('https://internal-metrics.'),
      // Only forward the trace id to your own services
      propagateTraceId: (url) => url.includes('.svc.cluster.local'),
    },
  },
});
Set outgoing: false to switch all of it off, or database: false / http: false individually.
Hint These spans are not billed. They are detail about a method span you already sent, so they don't count toward your Observability Events or your rate cap. A request that runs ten queries costs the same as before.
WebSocket gateways#
Messages handled by @SubscribeMessage() are reported as requests with the ws protocol and an operation id of GatewayClass:pattern, on any platform adapter. The ws option block takes the same ignore, tags, setAttributes, and getUserId hooks as the other transports; each receives { gateway, pattern, client, data }. Connections and disconnections are not operations and are not reported.
Queues#
@nestjs/bullmq and the original @nestjs/bull are both instrumented: every processor run is reported as a job, with its queue wait, attempt number, and outcome. A job added from inside a traced operation inherits that operation's trace id - see Distributed tracing.
Runtime metrics and profiling#
ObserveModule.forRoot({
  // ...
  runtimeMetrics: true,
  runtimeMetricsInterval: 60000,
});
runtimeMetrics (default true) samples memory, CPU, garbage collection, and event loop latency on an interval (runtimeMetricsInterval, default 60000 ms) and feeds the Profiler. The same samples double as the application's heartbeat: a Telemetry silence alert fires when they stop arriving, which gives you lightweight uptime monitoring without an external probe.
Errors and failed requests#
An error that escapes a controller, resolver, or job is captured automatically. These options decide what comes with it: the source code around the failing frame, and the headers and body of the request that failed.
Error source context#
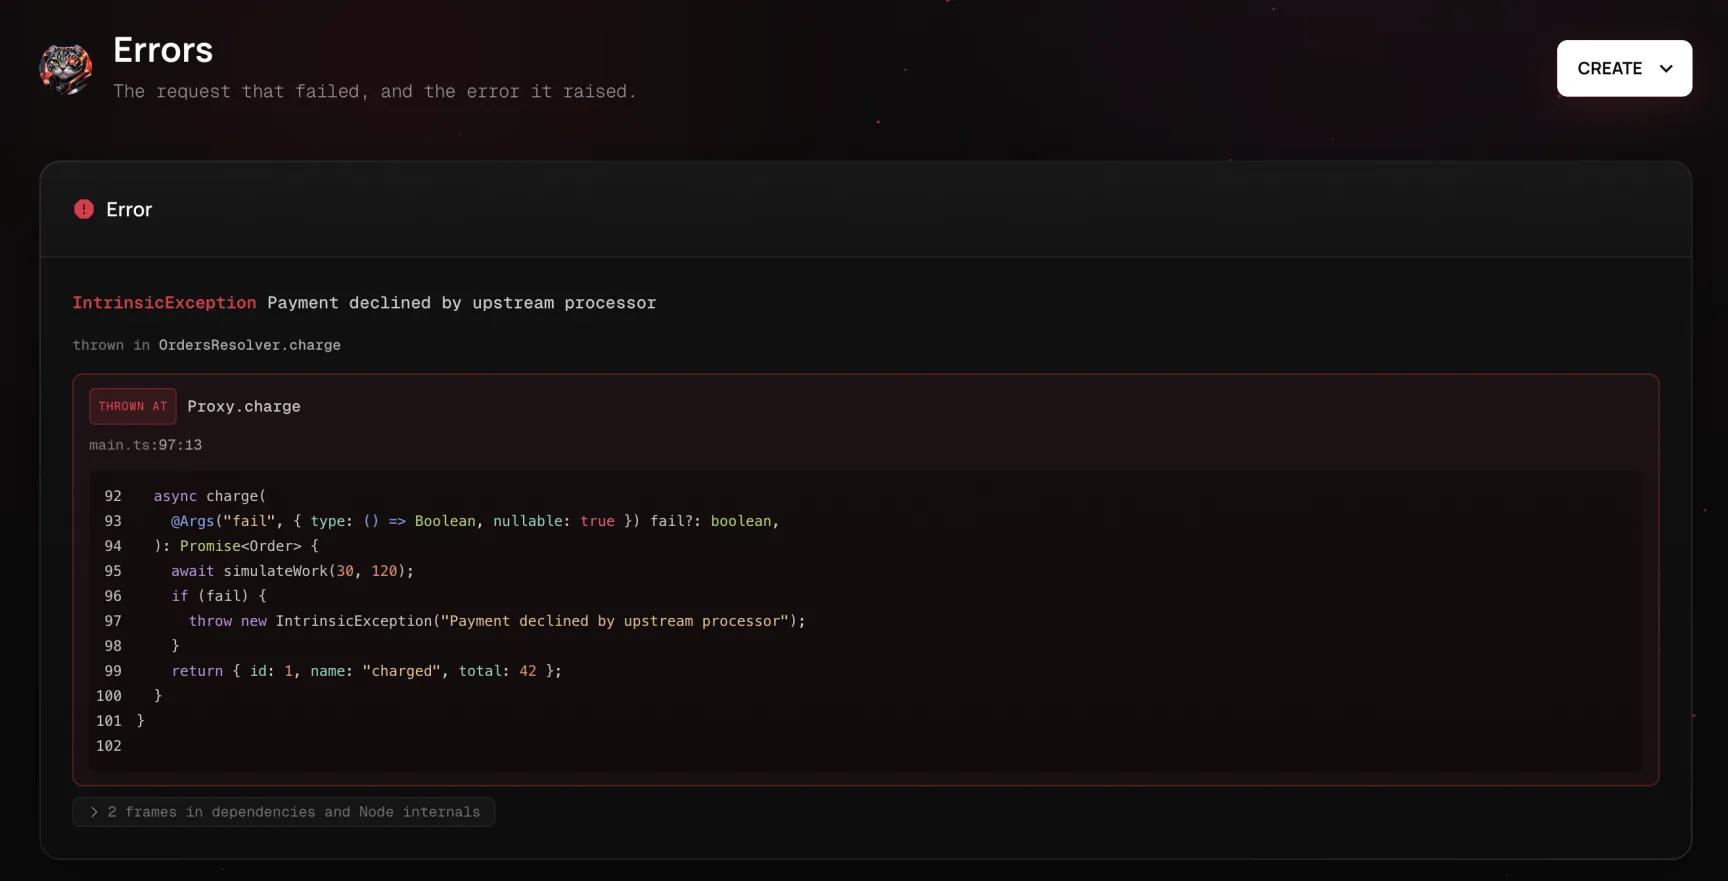
Errors that propagate out of a controller, resolver, job, or span are captured automatically. When sourceContext is enabled (the default), the SDK also reads the source lines around each in-app stack frame of a captured error and attaches them. This lets the dashboard show the failing code alongside the stack trace, even for a production failure on a build you don't have checked out.
export const { ObserveModule, ObserveInstrument } = createObserveModule({
  sourceContext: {
    linesOfContext: 5,
    maxFrames: 5,
    sourceMaps: false,
  },
});
This is an option of createObserveModule(), not forRoot(). Set sourceContext: false to disable it, or pass an object to tune the defaults:
| Option | Type | Default | Description |
|---|---|---|---|
linesOfContext | number | 5 | Lines read on either side of the frame's line. |
maxFrames | number | 5 | How many in-app frames, counted from the top of the stack, get source attached. Bounds the payload on deep stacks. |
sourceMaps | boolean | false | Resolves compiled frames back through source maps before reading source. Only needed if the process runs compiled output without Node's own source map support (--enable-source-maps or process.setSourceMapsEnabled(true)); with that on, frames already carry original positions and this is redundant. Costs a map parse per compiled file on first touch, cached after. |
Warning Enabling this ships fragments of your application's source code (usually a few lines around the error) to your dashboard, where they are stored alongside the error. Frames inside node_modules and Node internals are never read, only application source. Turn it off if shipping any source is not acceptable for your codebase.
Capturing failed and slow requests#
When an HTTP request fails, the SDK records a small, fixed allow-list of its headers alongside it - user-agent, content-type, content-length, accept, host, origin and referer. None of these authenticate or identify the caller. If you set slowerThanMs, requests that ran at least that long are captured the same way, failed or not. An ordinary request records nothing. Request bodies are off by default; turn them on explicitly if you want them:
ObserveModule.forRoot({
  // ...
  http: {
    capture: {
      headers: ['user-agent', 'x-tenant-id'],
      body: { maxBytes: 4096 }, // default 2048, at most 16384
      slowerThanMs: 2000,
    },
  },
});
Everything captured passes through redaction before it leaves the process: sensitive keys (password, token, authorization, ...) are masked by name inside the body, and naming a sensitive header records [REDACTED] instead of its value. capture: false records nothing. The capture is shown on the request's detail page as a Request card.
Logs and trace correlation#
Every execution gets a trace id. These options decide how your log lines relate to it: forwarded to the dashboard, or only stamped with the id so your own log stack can link to the trace.
Logs#
ObserveModule.forRoot({
  // ...
  forwardLogs: true,
  redaction: {
    enabled: true,
    keys: ['internalToken'],
    patterns: [/acct_[a-z0-9]{16}/gi],
  },
});
forwardLogs (default false) sends your application's log lines (anything written through Nest's Logger) to the dashboard, correlated to the trace that was active when each line was written. On an execution page, every line is placed on the trace's clock next to the span that was in flight when it was written. Log forwarding is available on Pro and above.
Forwarding logs moves them onto infrastructure you don't control, so redaction is on by default. The same redaction also scrubs the message and stack of every captured error and any captured request data, whether or not forwardLogs is on:
redaction field | Type | Default | Description |
|---|---|---|---|
enabled | boolean | true | Whether anything is scrubbed at all. |
useDefaultPatterns | boolean | true | Applies the built-in patterns: bearer tokens, JWTs, AWS key ids, PEM private keys, key=value secrets, and Luhn-valid card numbers. Disable only if you're replacing them wholesale with your own patterns; there's no supported case for forwarding logs unredacted. |
patterns | RegExp[] | - | Extra patterns to mask, for secrets shaped in a way only your codebase knows (internal token prefixes, customer identifiers). Always applied as if global, so a match is never limited to the first occurrence in a line. |
keys | string[] | - | Extra keys whose values are masked outright (in log attributes, captured headers and bodies, and URL query strings), on top of the built-in list. Compared case-insensitively and ignoring -/_, so apiKey, api_key, and API-KEY are one entry. |
replacement | string | '[REDACTED]' | Text substituted for anything matched. |
Hint Even withforwardLogsoff, the SDK augmentsConsoleLoggerso every line written inside a traced execution carries its trace id (attachTraceIdToLogs, see Trace correlation). That lets you correlate your own log aggregator with traces in the dashboard without shipping the log content anywhere.
Trace correlation#
These are also options of createObserveModule(). They shape how requests get a trace id and how that id shows up in your own logs:
import { randomUUID } from 'node:crypto';

export const { ObserveModule, ObserveInstrument } = createObserveModule({
  traceIdKey: 'traceId',
  traceIdGenerator: (req: any) => req.headers['x-request-id'] ?? randomUUID(),
  attachTraceIdToLogs: true,
});
| Option | Type | Default | Description |
|---|---|---|---|
traceIdKey | string | 'traceId' | The key used to store the trace id in the request context, for later retrieval through TracerService. |
traceIdGenerator | (req: unknown) => string | Adopts a well-formed x-request-id (HTTP header, or TCP/Redis packet metadata) if present, else a UUID v7 | Generates the trace id per request. Called with the request object for HTTP; for other protocols it receives the transport context. |
attachTraceIdToLogs | boolean | true | Augments ConsoleLogger to include the trace id in log messages, so logs can be correlated with traces even without forwardLogs. In the default text format the id ends the line, after the message ( Trace ID: <id>); with JSON logging it is a traceId field. Lines written outside a traced execution are unchanged. |
Because the default generator adopts an incoming x-request-id, a chain of HTTP services already shares one trace with no extra configuration. The same applies to the TCP and Redis microservice transports on @nestjs/microservices 12.0.4 or later. Propagating across gRPC, the other microservice transports, and GraphQL takes a few lines - see Distributed tracing.
Shaping what is recorded#
These options enrich what the SDK records (who a request was for, what it concerned) and keep out what you don't need.
Associating users with telemetry#
getUserId reads the incoming request and returns whatever identifier your system uses for a person: a user id, an account id, or a tenant-scoped id. Set it once and the Users view populates automatically:
ObserveModule.forRoot({
  // ...
  http: {
    getUserId: (req) => req.user?.id ?? 'anonymous',
  },
});
The same option exists on rpc (receiving the transport id and the BaseRpcContext), grpc (receiving the call object), graphql (receiving the GraphQL context, for operations with no enclosing HTTP request), and ws (receiving the gateway message), each reading the transport's own context instead of an HTTP request. Reporting a user identifier is optional: traffic without one still shows up everywhere except the per-user views. The dashboard treats the identifier as an opaque string and never tries to resolve it into a name or an email, so prefer an opaque internal id over anything personally identifying.
Tags and custom attributes#
http, rpc, grpc, graphql, and jobs each accept the same two options for attaching your own data to every request they cover:
| Option | Applies | Description |
|---|---|---|
tags | The same static Record<string, string> to every request | For constants that don't vary per call, e.g., project, env, region. |
setAttributes | A function of the request/call/job, returning key-value pairs | For anything that varies per call, e.g., a feature flag, a tenant id, a queue name. |
ObserveModule.forRoot({
  // ...
  http: {
    tags: { project: 'cats-app', env: process.env.NODE_ENV ?? 'development' },
    setAttributes: (req) => ({
      'user-agent': req.headers['user-agent'],
      'client-ip': req.ip,
    }),
  },
  jobs: {
    setAttributes: (job) => ({ queueName: job.queueName, jobName: job.name }),
  },
});
Both appear as tags on the resulting request, job, or span, and are searchable and visible on its detail page. The function receives whatever the transport has: the request for http, the transport id and BaseRpcContext for rpc, the call object for grpc, the resolve info and GraphQL context for graphql, and { queueName, name, id } for jobs. To tag a single span from inside your code rather than every request, use TracerService (see Manual instrumentation).
Hint A GraphQL server is usually an HTTP endpoint, so its requests are already subject to thehttpoptions:http.ignoredrops a request before the GraphQL layer sees it, andhttp.getUserIdsupplies the user for queries over HTTP. Thegraphqlblock tunes what happens inside a request that was let through, per operation rather than per resolver, andgraphql.getUserIdis only consulted for operations that aren't already inside an HTTP trace, such as subscriptions over a WebSocket.
Ignoring noisy operations#
Every inbound transport block (http, rpc, grpc, graphql, and ws) has an ignore option that skips instrumentation entirely for matching calls, such as a health check endpoint, an internal probe, or anything else not worth a trace:
ObserveModule.forRoot({
  // ...
  http: {
    ignore: ['/health', { method: 'GET', path: /^\/internal\// }],
  },
  rpc: {
    ignore: (transportId, ctx) =>
      ctx instanceof TcpContext && ctx.getPattern() === 'ping',
  },
  grpc: {
    ignore: (call) => call.path.endsWith('/Health/Check'),
  },
  graphql: {
    ignore: (info) => info.fieldName === 'healthcheck',
  },
});
http.ignore accepts an array of paths, { method, path } pairs (path can be a string or a RegExp), and plain RegExps or a single predicate function over the request. rpc.ignore, grpc.ignore, and graphql.ignore are predicates over the transport's own context (the @nestjs/microservices transport id and BaseRpcContext, the gRPC call object, and the GraphQL resolve info respectively). Matching a GraphQL field name skips the whole operation that field leads, not only that field: an operation is measured end to end, so it is either traced or not.
ignore stops telemetry from being generated at all. The dashboard's spend-control drop filters are a different tool: they discard already-generated events at ingestion to reduce billed volume. Use ignore when you don't want a trace to exist, and drop filters when you want to tune cost on data the SDK is already producing.
http additionally takes queryParamsObfuscateRegex, a RegExp that masks sensitive query string values before they're sent. It is applied on top of the built-in redaction, which always masks well-known sensitive parameters (token, password, code, signature, and so on).
Trace sampling and batching#
ObserveModule.forRoot({
  // ...
  tracesSampleRate: 0.25,
  maxTracesPerBatch: 1000,
  flushInterval: 5000,
});
| Option | Type | Default | Description |
|---|---|---|---|
tracesSampleRate | number | ((protocol: 'http' | 'rpc' | 'grpc' | 'graphql' | 'ws', attributes) => boolean) | 1.0 | Fraction of traces sent, or a predicate for per-trace decisions. 1.0 sends everything; 0.1 sends 10%. |
maxTracesPerBatch | number | 1000 | Caps how many traces go out per batch, to bound volume on high-traffic applications. |
flushInterval | number (ms) | 5000 | How often the SDK batches and sends collected traces. |
Telemetry is buffered in the process and shipped on the flush interval rather than inline with each request. Sampling here decides what the SDK produces. The dashboard's per-project spend controls (span sampling, rate caps, drop filters) act on what it has already sent, and you can change them without a redeploy.
Full configuration reference#
All options at a glance. Options listed under createObserveModule() must be set there; everything else goes to forRoot()/forRootAsync().
| Where | Option | Purpose |
|---|---|---|
createObserveModule() | sourceContext | Attach source lines to error stack frames |
createObserveModule() | traceIdKey | Context key the trace id is stored under |
createObserveModule() | traceIdGenerator | How each request obtains its trace id |
createObserveModule() | attachTraceIdToLogs | Add the trace id to ConsoleLogger output |
createObserveModule() | skipInstrumentation | Predicate that excludes provider instances from instrumentation |
forRoot() | appKey, appSecret | Project API key pair |
forRoot() | endpoint | Collector base URL (or OBSERVE_ENDPOINT) |
forRoot() | serviceId, serviceVersion | Application and release identity |
forRoot() | http, rpc, grpc, graphql | Per-transport tags, setAttributes, getUserId, ignore |
forRoot() | jobs | tags and setAttributes for queue and scheduled jobs |
forRoot() | http.queryParamsObfuscateRegex | Mask sensitive query string values |
forRoot() | http.capture | Headers (and optionally body) recorded for failed and slow requests |
forRoot() | outgoing | Database query and outbound HTTP spans |
forRoot() | ws | WebSocket gateway tags, setAttributes, getUserId, ignore |
forRoot() | runtimeMetrics, runtimeMetricsInterval | Profiler samples and heartbeat |
forRoot() | forwardLogs, redaction | Logs streaming and scrubbing |
forRoot() | tracesSampleRate | Fraction (or predicate) of traces to send |
forRoot() | maxTracesPerBatch, flushInterval | Batching |
forRoot() | spanCollapse | Collapse repeated sibling spans (default threshold 20, keep slowest 3) |
forRoot() | debug | SDK diagnostics |
Where to go next#
- Manual instrumentation - add your own spans, capture handled errors, attach request-scoped attributes, and report custom metrics.
- Distributed tracing - keep one trace across HTTP, gRPC, microservice transports, and GraphQL.
- Dashboard - what shows up once the SDK is running, and how the views relate to each other.