
Error monitoring
Error monitoring is included on every NestJS Observe plan, Free included, and needs nothing beyond the SDK: once your application is instrumented, every error that escapes a controller, resolver, or queue consumer is captured with the request it broke, the code that threw it, and the trace it ran in. This page covers what gets captured, how occurrences are grouped into defects, how you get told about a new one, and how an error turns into a verified fix.
Hint Want to see it before installing anything? The live demo has a busy service's errors, grouped defects, and stack traces with source, with no signup.
What is captured#
Errors that propagate out of a controller, resolver, job, or span are recorded automatically - across HTTP, GraphQL, gRPC, and @nestjs/microservices transports, and for queue consumers and cron runs. There is no error handler to register and nothing to call from your exception filters: a filter still decides what the client sees, and the SDK observes the failure on its way there, so the two work side by side.
An error is not stored as a detached log line. An individual error is the failed request, so its detail page is the request's own page with the failure leading: error class, message, stack trace, and source code first, then the request's context, then the trace waterfall and the logs written during that request. When an HTTP request fails, the SDK also records a small allow-list of its headers, and optionally its body - see Capturing failed and slow requests. A job run that throws is recorded as a failed run, with its failure reason and attempt number, in the Jobs view.
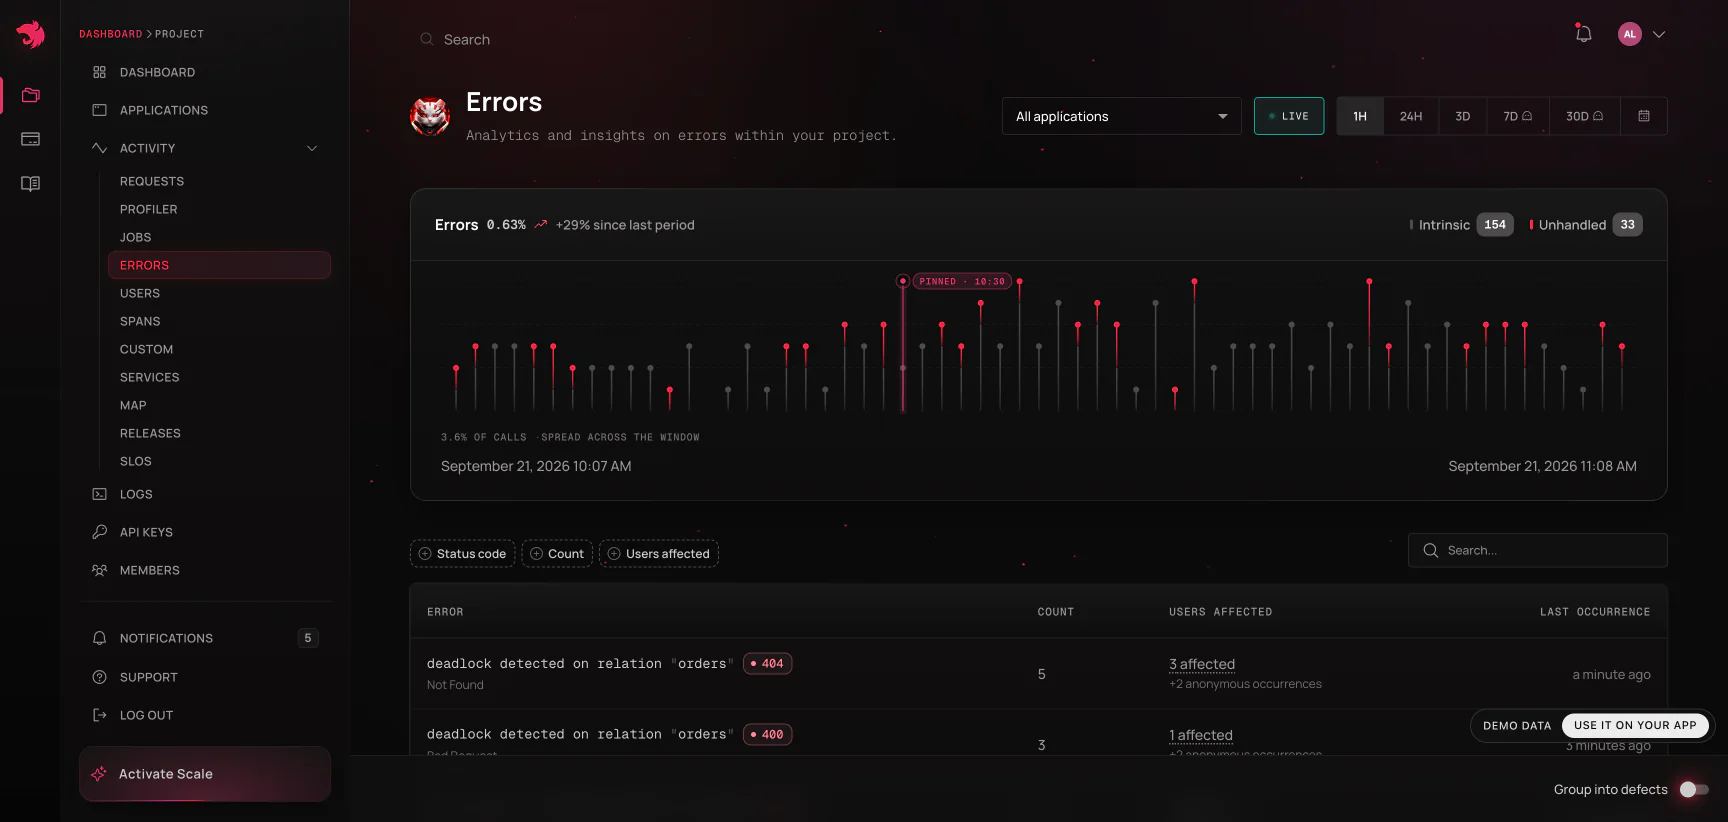
Not every error is a bug. An exception your code throws on purpose - a NotFoundException, a failed validation - still shows up in the Errors view, since it is still a failed request, but it doesn't count as a new defect for alerting. Only unhandled failures do: an error whose request answered with a 5xx, or one that failed an entry point with no HTTP status at all, such as an RPC handler or a gateway message.
Source context#
A stack trace from production usually points at compiled output you don't have checked out. With sourceContext enabled (the default), the SDK reads the source lines around each in-app frame of a captured error and sends them along, so the dashboard shows the failing code next to the stack trace:
export const { ObserveModule, ObserveInstrument } = createObserveModule({
  sourceContext: {
    linesOfContext: 5,
    maxFrames: 5,
  },
});
To see your TypeScript rather than the compiled JavaScript, run Node with source map support (--enable-source-maps, or process.setSourceMapsEnabled(true)), or set sourceContext.sourceMaps: true to have the SDK resolve compiled frames itself. Frames inside node_modules and Node internals are never read. See Error source context for every option.
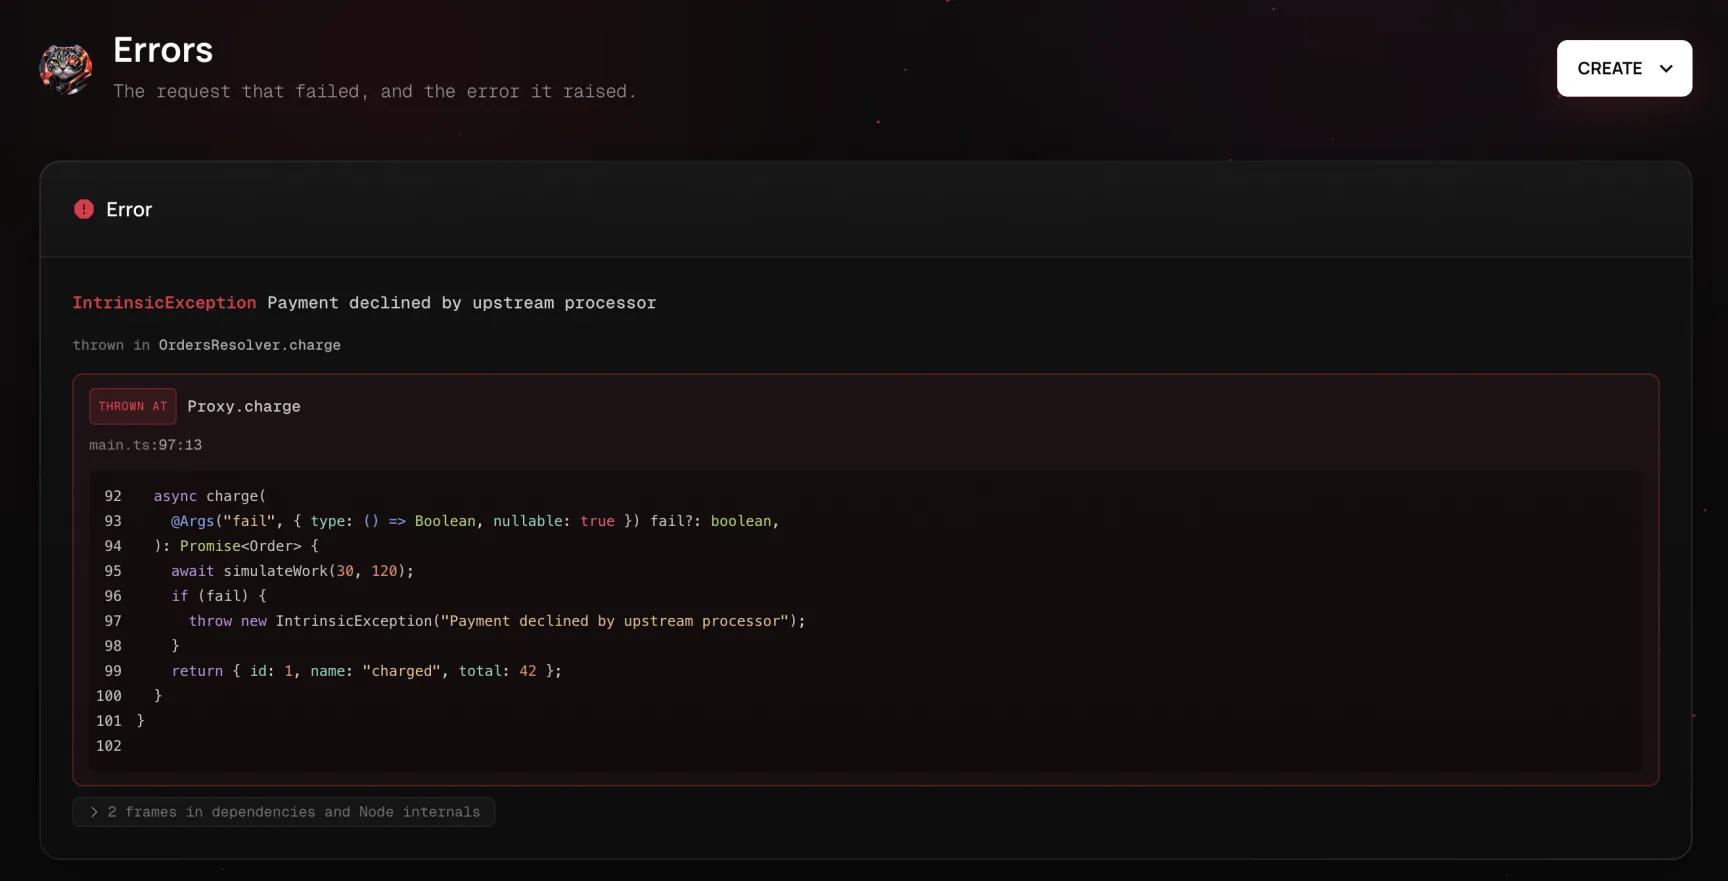
Warning Source context ships a few lines of your application's source code to your dashboard, stored alongside the error. Set sourceContext: false if shipping any source is not acceptable for your codebase.
Handled errors#
An error you catch and recover from never propagates, so it is never captured automatically. When you still want it visible, report it with captureError() on TracerService:
try {
  await this.billing.sync(accountId);
} catch (error) {
  await this.tracerService.captureError(error, {
    accountId,
    retryable: 'true',
  });
}
The error is attached to the current trace with the optional tags recorded alongside it, and gets the same source context as any other captured error. See Capturing handled errors.
Grouping errors into defects#
A spike of 3,140 TypeErrors is one bug, not 3,140. The Group into defects switch on the Errors page collapses occurrences with the same exception class and the same normalized stack shape into one error group, fingerprinted server-side - however the message was worded, whichever line numbers moved, whichever deploy produced it.
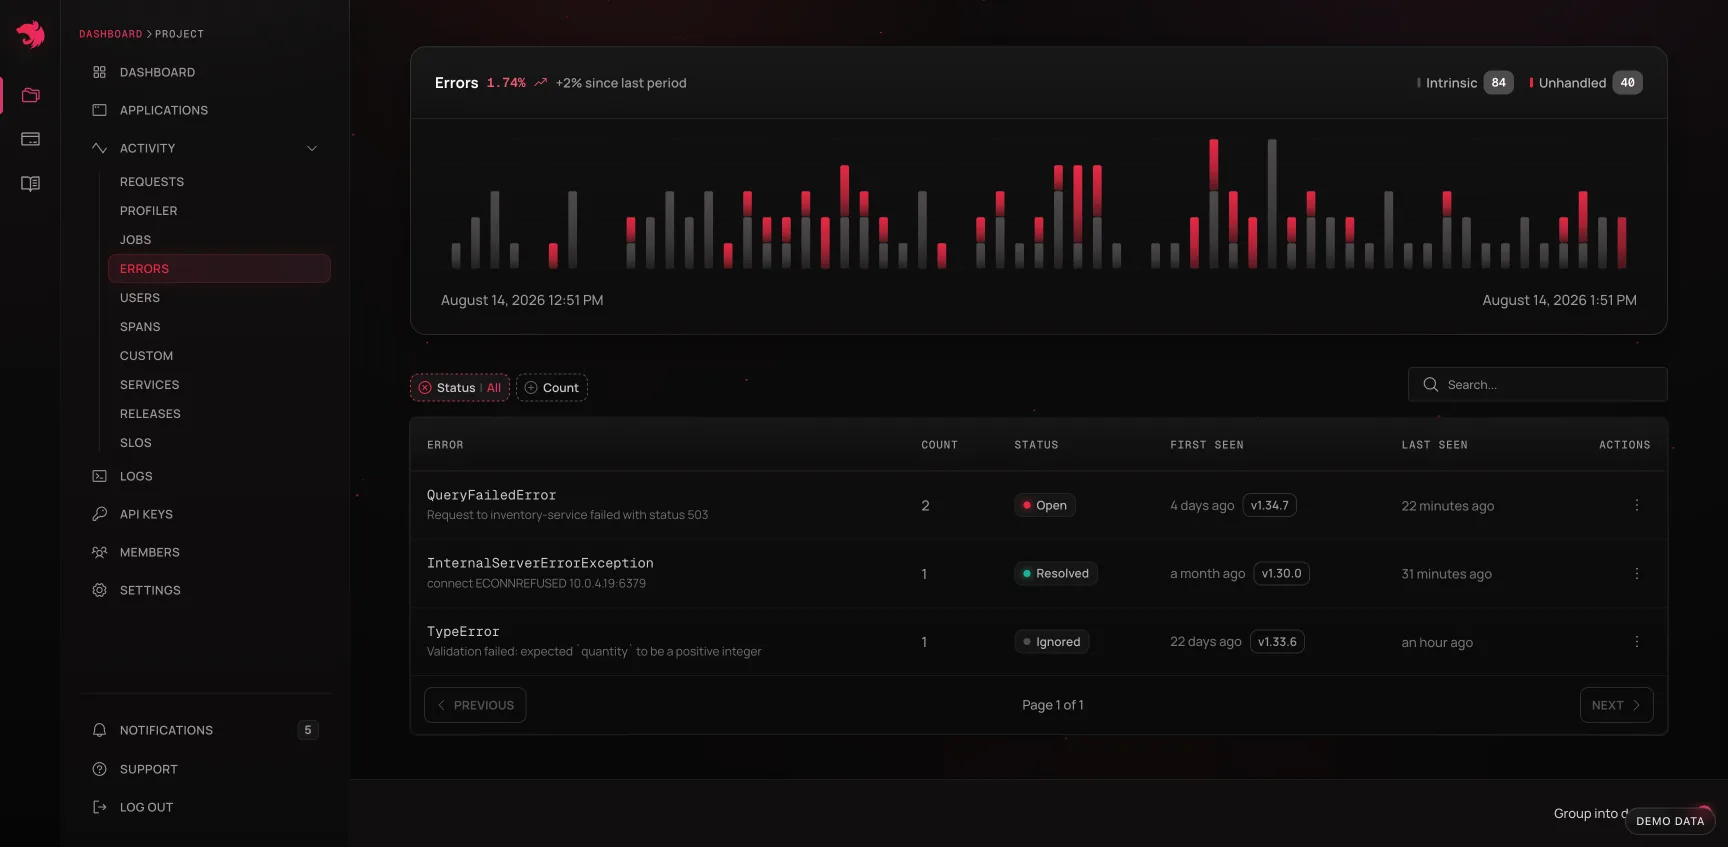
A group carries what triage needs rather than what a single occurrence has:
| Field | What it tells you |
|---|---|
| Class and sample message | What the defect is, taken from its first occurrence |
| Status | Open, Resolved, or Ignored |
| First and last seen | Whether it's new, ongoing, or has gone away |
| Introduced in | The release the first occurrence ran on, when it reported one |
| Occurrences | How often it fired in the selected window, not all time |
| Issue | The issue it was promoted to, if any |
Introduced in comes from the serviceVersion your application reports - a semantic version or a commit hash, passed to forRoot(). Without it, a group can't say which deploy it arrived with.
The two closed states are deliberately not symmetric. Resolved is a claim about the code, so a resolved group reopens the moment the error recurs - a fix that didn't hold surfaces itself instead of staying quietly green. Ignored is a decision about the noise, and stays ignored.
Getting notified#
Every plan, Free included, gets a built-in new-error email with no rule to set up: one email per project listing the errors it has never seen before, at most six a day. Each member can switch it off for themselves under Settings → New error emails.
On paid plans, alert rules go further:
- A new error groups rule fires when a defect appears for the first time, for one application or the whole project, and notifies through email, Slack, a webhook, an in-app notification, or by opening an issue.
- An error rate rule watches the share of failed requests for an application, or for one route and method, against a fixed threshold or against its own recent baseline with anomaly detection.
- A job failure rate rule does the same for queue consumers and cron runs.
On the higher tiers, an availability SLO - the share of requests that finished without an unhandled error - turns the same errors into an error budget with burn-rate alerts.
From an error to a fix#
Because each error already carries its stack trace, source lines, trace, and logs, Copy agent prompt on its page packages all of it into a self-contained prompt for a coding agent - Claude Code, Cursor, or whatever has your repository open. An agent connected to the MCP server can go further on its own: list error groups with their introducing release, pull recent occurrences with their trace ids, tell whether an error is growing or decaying, and see which users it hit.
To track the work, promote an error group into an issue in one click; promoting a group that already has an open issue links to it instead of opening a second one. When you mark the issue resolved - optionally naming the release the fix shipped in - the dashboard watches the affected operation against its pre-incident baseline, and either closes the issue once the fix has held or reopens it with the reading that broke it.
After a deploy, the Releases view compares each serviceVersion against the one before it, error rate included, so a regression shows up as a difference between two versions rather than as a bump somewhere in a week-long chart.