Overview
NestJS Observe is the official, auto-instrumented application performance monitoring (APM) and observability platform for NestJS applications. Install the SDK, add an API key, and your application starts streaming requests, background jobs, errors, logs, and traces to your dashboard - no manual span wiring, no collector to run, no schema to design, no dashboards to build by hand.
Hint This chapter covers how to instrument a NestJS application with the @nestjs/observe SDK and what that instrumentation gives you. If you're looking for the dashboard itself, go to observe.nestjs.com, or open the live demo - the full dashboard over a busy service's data, with no signup and nothing to install.
How it differs from a generic Node.js APM#
Generic Node.js APM agents attach to the HTTP server and the database driver and leave everything in between as a black box. NestJS Observe is built around Nest's own request lifecycle - controllers, guards, interceptors, pipes, resolvers, queue consumers - so telemetry is expressed in the vocabulary you wrote the code in: OrdersService.recalculate, not POST /orders. That is also why it can show time spent per NestJS class and method, not only per route, and why a trace waterfall from an unmodified application already reads like a call graph.
The SDK attaches to the framework through the instrument application option of NestFactory.create() (available since @nestjs/core v11.1.4), so it sees every controller, provider, resolver, and queue consumer as Nest wires them - no process-wide patching, and nothing to import before the rest of your code.
What it offers#
Once the SDK is running, every plan - including the free tier - gives you:
- Request monitoring for HTTP, GraphQL, gRPC, and
@nestjs/microservicestransports: throughput, latency (average and p95), failure rate per operation, and a detail page for every single execution. - Distributed tracing with a waterfall of every span a request ran, self-time ranking to find where the time actually went, and correlation across services once a trace id is propagated (see Distributed tracing).
- Error monitoring with the stack trace, the source lines around the failing frame, and server-side grouping of occurrences into defects.
- Jobs - queue consumers and cron runs (for example, BullMQ) get the same treatment as requests, plus queue wait time and retry attempts.
- Services - a per-class, per-method breakdown of own time vs. total time across your application.
- Runtime profiling - CPU, memory, event loop delay and utilization, and garbage collection, sampled from inside the process and compared per instance.
- Releases - every request and job records the version that served it, so a regression introduced by a deploy is visible immediately.
- Custom metrics - counters, gauges, and summaries reported from your own code.
- Users - per-user activity, grouped into the actions they actually performed, when your application reports a user identifier.
- Copy agent prompt - one click turns a failed request, slow job, or failing trace into a self-contained prompt for a coding agent.
Paid plans add logs streaming (correlated to traces, with redaction on by default), alerting (thresholds, anomaly detection, absence detection, Slack/webhook/email channels), issues, team management, and - on the higher tiers - SSO, SLOs with error budgets and burn-rate alerts, and an MCP server so an MCP-compatible agent can query your telemetry directly and set up a new service (see MCP server).
How it is organized#
NestJS Observe organizes your telemetry in three layers:
- A team is a collection of users. Every project belongs to exactly one team, and team membership is how you grant someone access to more than one project at a time. Subscriptions are managed per team.
- A project is a collection of applications that ship together, typically one per product or environment (e.g.
storefront-production,storefront-staging). Projects are what alerts, issues, SLOs, and API keys are scoped to. - An application is a single NestJS service - a REST API, a worker, a microservice - instrumented with the SDK and reporting into a project. A project usually has more than one application (a web API and the queue workers behind it, for example), so you can see them as one system while still filtering down to either.
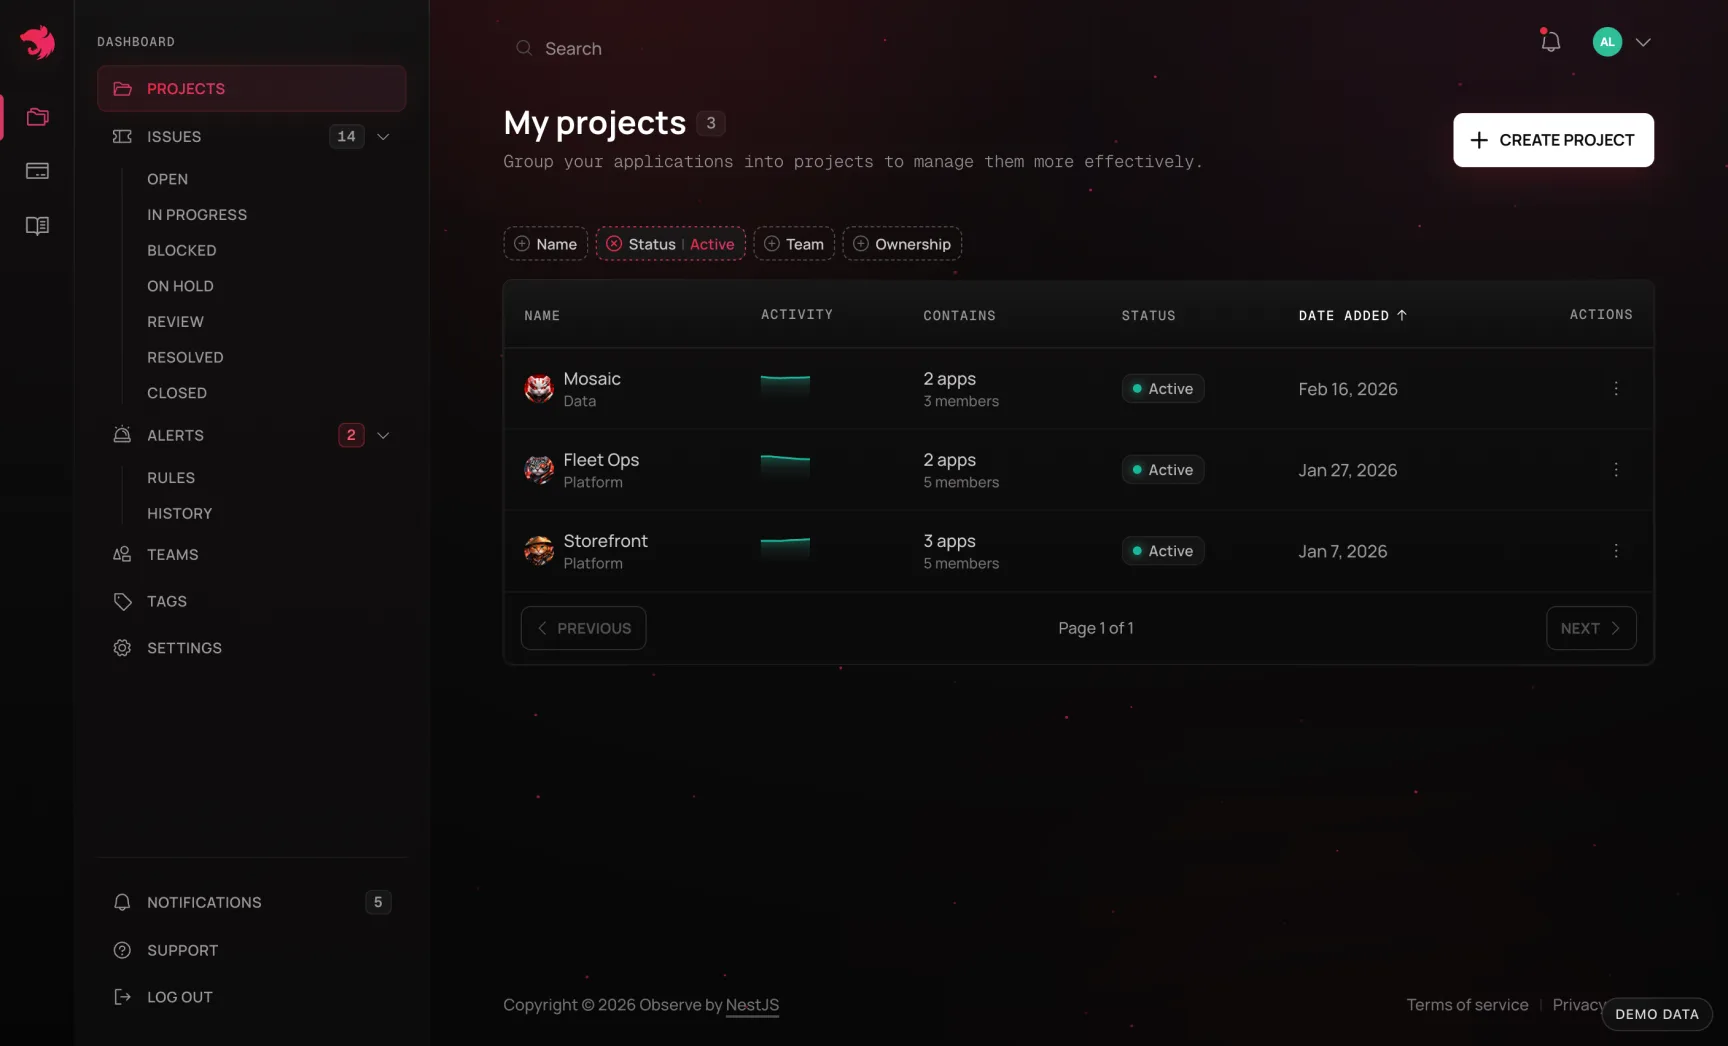
Every project member has one of three access levels - Read, Write, or Admin - controlling whether they can view telemetry, create alert rules, applications, and API keys, or manage members and spend controls.
Subscribing#
Sign up at observe.nestjs.com. The Free plan needs no payment details and already includes error monitoring, distributed tracing, and auto-instrumentation, so you can instrument an application and see real traces before deciding whether you need more.
Usage is metered in Observability Events (OEs) - one per request, background job run, error, log entry, or trace span your applications report. Events add up rather than merge: a request that ran through three of your own methods, wrote two log lines, and raised one error is seven events. The agent's own database-query and outbound-HTTP spans don't count, because they are detail about a method span that is already counted. Your plan sets a monthly allowance of included events, a retention window, and which features are unlocked:
| Plan | Included events / month | Retention | Logs & alerts | SSO & SLOs |
|---|---|---|---|---|
| Free | 300k | 3 days | ✗ | ✗ |
| Pro | 25M | 30 days | ✓ | ✗ |
| Scale | 200M | 90 days | ✓ | ✓ |
| Enterprise | Negotiated | Negotiated | ✓ | ✓ |
Free has a hard monthly limit - once it is reached, ingestion is rejected until the next period. Pro and Scale allow overage instead of a hard stop, billed per additional million events, so a busy month doesn't mean lost telemetry. Annual billing is discounted against the monthly price. For current prices, seat counts, and overage rates, see the pricing page.
To upgrade, open Billing → Manage subscription for the team that owns your projects. From the same area, the Usage page tracks your Observability Events against the allowance, broken down by project, and lets you set quota notifications (up to five thresholds, e.g. 50%, 80%, 100%) to get an email when usage crosses one.
Hint Ingestion volume is controllable without a redeploy through per-project spend controls: trace-coherent span sampling, a per-minute rate cap, and drop filters for known-noisy traffic like /health*. Errors are never sampled or dropped by these controls. You can also stop telemetry from being generated at all on the SDK side - see Ignoring noisy operations.
First project#
A new account is offered a short setup guide that walks through the real pages - it highlights Create Project, then takes you into the new project to add an application and an API key, and finishes on the banner that waits for your first event. The same steps by hand:
- Create a project and give it a name.
- Add an application to it. An application needs nothing beyond a name - the routes it serves, the jobs it processes, and the metrics it reports are all discovered from the telemetry the SDK sends.
- Generate an API key from the project's API Keys page. Each key has a name (one for local development, one for CI, one for production) and an optional expiration date. The key pair (
appKeyandappSecret) is shown once, at creation, so copy it into your secrets store right away. Keys are scoped to a project: every application whose telemetry should land in that project uses the same key. - Instrument your application by following the SDK chapter. Telemetry starts appearing within moments of your application receiving traffic.
Hint If you're setting up with a coding agent, use the Copy setup prompt button in the dialog that shows a new key's secret. It combines the install command, the three code edits, and the credentials into one prompt. An agent connected to the MCP server can create the application and the key itself.
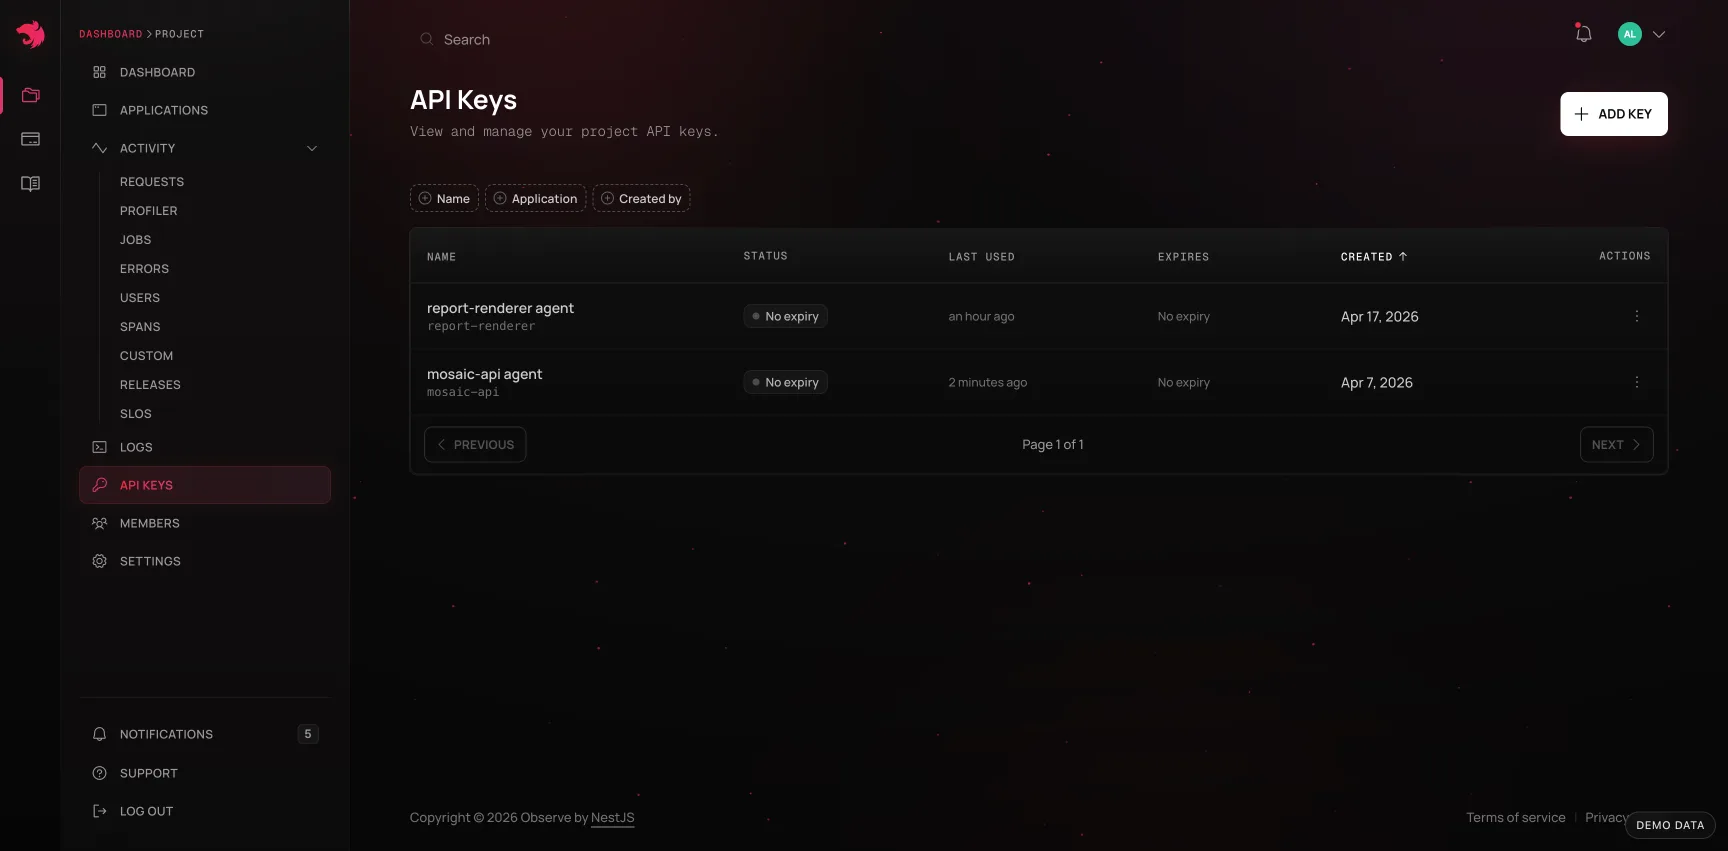
Warning TreatappKeyandappSecretlike any other credential: read them from environment variables or a secrets manager, never commit them to source control. You can revoke a key from the same page at any time; applications still using it can no longer send telemetry.
Where to go next#
- SDK - installation, the three-line quick start, and every configuration option.
- Manual instrumentation - custom spans, handled errors, request-scoped attributes, and custom metrics.
- Distributed tracing - propagating a trace id across HTTP, gRPC, microservice transports, and GraphQL.
- Error monitoring - what gets captured, source context, grouping errors into defects, and getting from an error to a verified fix.
- Dashboard - what each view shows once telemetry is flowing, and how alerts, SLOs, and issues build on it.
- MCP server - querying your telemetry from Claude Code, Cursor, VS Code, or your own agent.